
Metrics and Grafana
Every Tayga service exposes Prometheus metrics. You do not need Prometheus to see them: tayga-api scrapes the other services itself, stores the samples in ClickHouse and charts them on the Pipeline page. Prometheus and Grafana are optional extras.
Where the metrics are
Section titled “Where the metrics are”| Service | Endpoint | Published on the host |
|---|---|---|
tayga-ingest |
:4318/metrics (the OTLP/HTTP port) |
with the OTLP port |
tayga-writer, tayga-assembler, tayga-logminer, tayga-notifier |
:9100/metrics (*.metrics_addr) |
no |
tayga-api |
:8090/metrics |
yes |
/metrics stays open when authentication is on. A service whose metrics port is taken fails to start with bind metrics server on <addr>. The images have no curl; to read a port that is not published, see the command for one replica.
The metrics
Section titled “The metrics”Counters carry the _total suffix in the exposition. Counters count accepted and committed work only: work that was retried after a failure is counted once.
tayga-ingest
Section titled “tayga-ingest”| Metric | Meaning |
|---|---|
tayga_ingest_records_published_total{kind} |
Kafka records published, one logical copy: logs count their tayga.signals records. |
tayga_ingest_log_records_published_total{topic} |
Records carrying logs, by topic (both copies). |
tayga_ingest_service_routed_items_total |
Spans and logs without a valid trace id, routed by service. |
tayga_ingest_oversized_dropped_total{topic} |
Single spans or logs dropped because alone they exceed kafka.max_record_bytes. |
tayga_ingest_publish_failures_total |
Requests answered UNAVAILABLE / 503 because Kafka delivery failed. |
tayga_ingest_rejected_requests_total |
Requests rejected as undecodable (HTTP 400). |
tayga-writer
Section titled “tayga-writer”| Metric | Meaning |
|---|---|
tayga_writer_rows_inserted_total |
Rows stored and committed. |
tayga_writer_batches_committed_total |
Batches inserted and committed. |
tayga_writer_batch_seconds |
Histogram of a successful batch insert. |
tayga_writer_insert_failures_total |
Failed ClickHouse insert attempts. |
tayga_writer_commit_failures_total |
Failed Kafka offset commits (the records are read again). |
tayga_writer_undecodable_records_total |
Records skipped because they could not be decoded. |
tayga-assembler
Section titled “tayga-assembler”| Metric | Meaning |
|---|---|
tayga_assembler_closed_traces_total |
Traces closed and analysed. |
tayga_assembler_stories_total |
Stories produced. |
tayga_assembler_open_traces, tayga_assembler_buffered_bytes |
Traces and bytes currently buffered. |
tayga_assembler_late_items_total |
Spans and logs that arrived after their trace closed. |
tayga_assembler_baseline_endpoints |
Endpoints with a loaded baseline. |
tayga_assembler_baseline_excluded_traces |
Traces above their cap, left out at the last baseline refresh. |
tayga_assembler_baseline_carried_endpoints |
Endpoints whose previous baseline was carried over at the last refresh. |
tayga_assembler_write_failures_total |
Failed ClickHouse or Kafka write attempts. |
tayga_assembler_analysis_panics_total |
Traces skipped after an analysis panic. |
tayga_assembler_serialization_failures_total |
Stories dropped because they could not be serialised. |
tayga-logminer
Section titled “tayga-logminer”| Metric | Meaning |
|---|---|
tayga_logminer_logs_mined_total |
Log records assigned to a template. |
tayga_logminer_templates |
Templates held in memory. |
tayga_logminer_templates_created_total |
Templates created by Drain. |
tayga_logminer_cluster_cap_hits_total |
Logs sent to a service’s <overflow> template. |
tayga_logminer_alerts_total |
Alerts created (updates of active spikes are not counted). |
tayga_logminer_silence_alerts |
Templates currently silent with silence alerts on. |
tayga_logminer_detect_seconds |
Histogram of one detection pass. |
tayga_logminer_data_lag_seconds |
Wall clock minus this replica’s data clock. |
tayga_logminer_alerts_republished_total |
Stored alerts published again because no publication was recorded. |
tayga_logminer_commit_failures_total |
Offset commits Kafka refused (the records are read again). |
tayga_logminer_write_failures_total |
Failed ClickHouse inserts of hits and templates. |
tayga_logminer_state_save_failures_total |
Failed saves of the watermark to logminer_state. |
tayga_logminer_spike_skipped_total{reason="coverage"} |
Spike candidates not judged for low baseline coverage. |
tayga_logminer_seasonal_failures_total |
Failed seasonal lookups (the flat rule was used). |
tayga_logminer_new_suppressed_total{reason="pre_epoch_match"} |
New-template candidates not alerted after a masking epoch. |
tayga_logminer_fingerprint_cache_hits_total, …_misses_total |
Lines assigned from the cache, and lines that went through the Drain tree. |
tayga_logminer_fingerprint_collisions_total |
Cache keys equal with a different check. |
tayga_logminer_fingerprint_cache_resets_total{reason} |
Service caches emptied: generalised or full. |
tayga_logminer_mine_batch_seconds |
Histogram of mining one Kafka record (buckets 1 µs × 4ⁿ, n = 0 to 9). |
tayga_logminer_fingerprinter{backend} |
1 for the backend in use, after any fallback. |
tayga-notifier
Section titled “tayga-notifier”See The notifier: tayga_notifier_deliveries_total{target,result}, tayga_notifier_delivery_seconds, tayga_notifier_pending, tayga_notifier_breaker_open{target}.
tayga-api
Section titled “tayga-api”| Metric | Meaning |
|---|---|
tayga_api_repo_errors_total |
Requests answered 503 because ClickHouse failed. |
tayga_api_scrape_failures_total{job} |
Recorder scrapes of a target that failed. |
tayga_api_lag_errors_total |
Consumer-lag reads from Kafka that failed. |
The recorder and the Pipeline page
Section titled “The recorder and the Pipeline page”Every 15 seconds (record_secs) tayga-api scrapes the /metrics of each entry in metric_targets (by default ingest, writer, assembler, logminer and notifier, by their Compose service names), adds its own registry as job tayga-api, and stores the samples in ClickHouse metric_samples (kept 7 days). Each target’s host is resolved on every tick; when it resolves to several addresses (logminer replicas), each one is scraped and labelled instance.
record_secs = 0(TAYGA__RECORD_SECS=0) turns the recorder off. Do that for an API you run on your host for development: it cannot reach the container targets and would recordup = 0for them.- Values from 1 to 4 log a warning, because every tick inserts a small part into ClickHouse.
- The targets are a list, so they are set in the config file only (see the configuration reference).
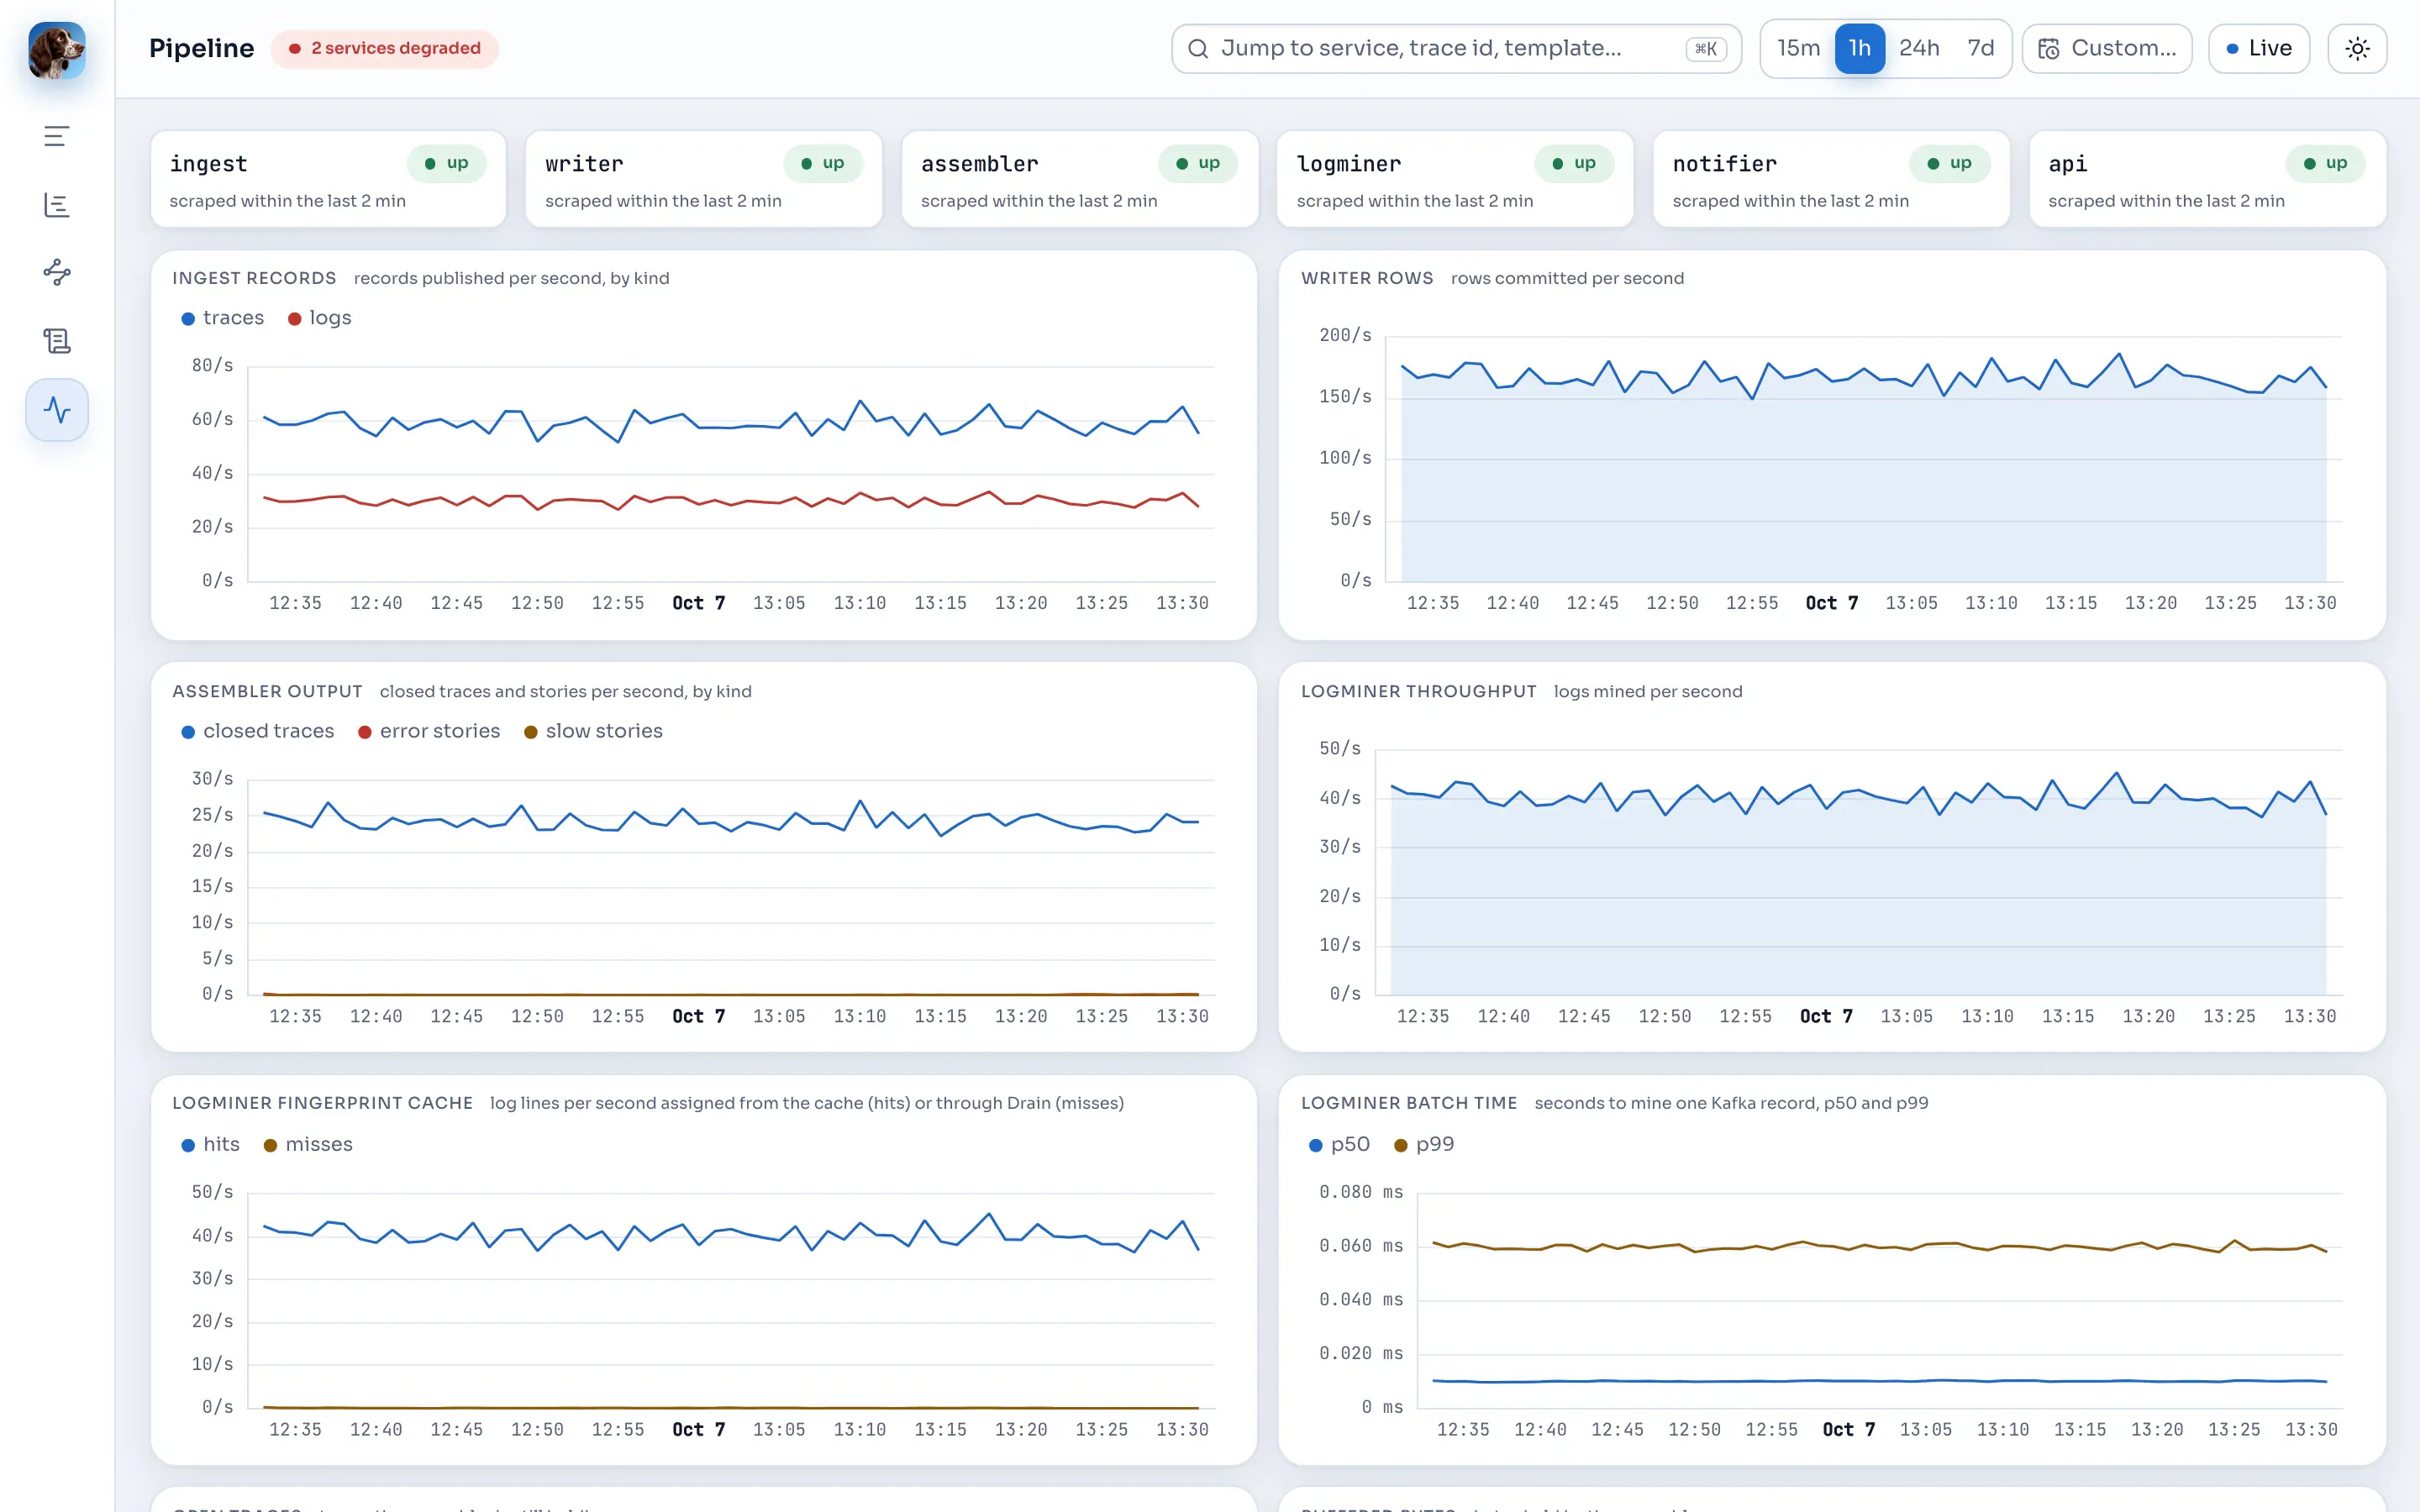
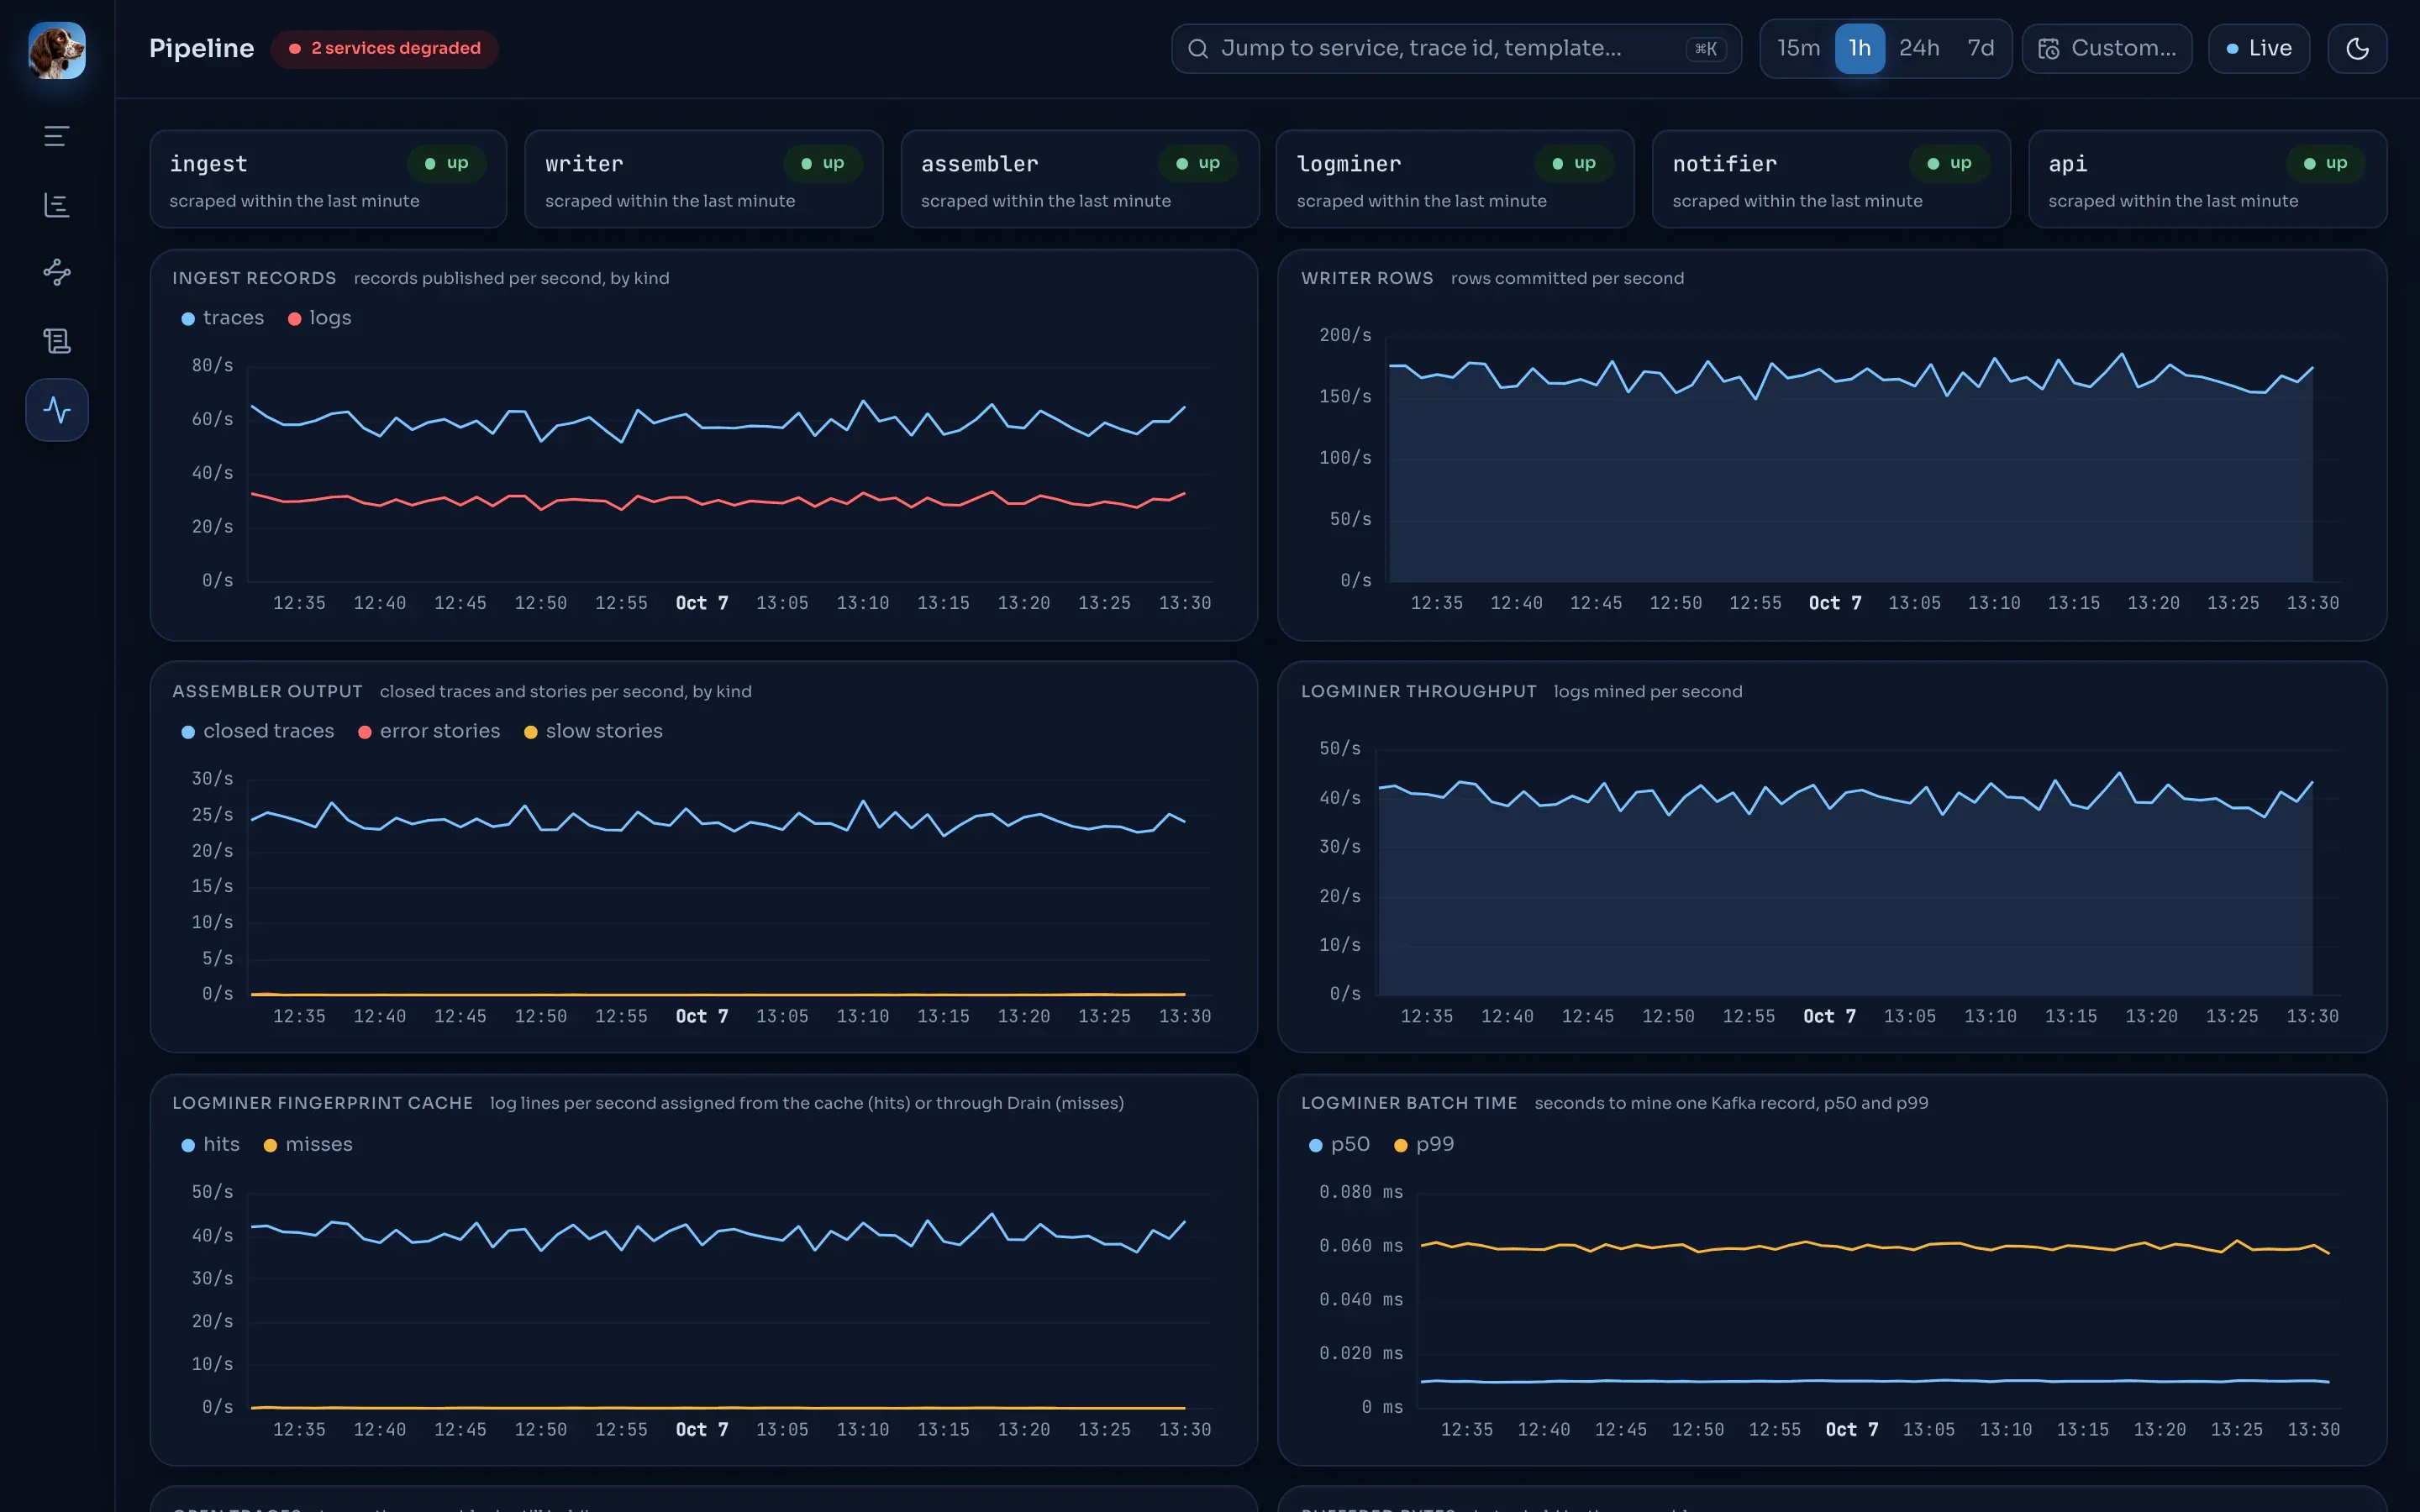
The Pipeline page reads the samples through GET /api/v1/pipeline/series and has 12 charts: ingest records, writer rows, assembler output, logminer throughput, logminer fingerprint cache, logminer batch time, open traces, buffered bytes, writer batch latency, logminer data lag, commit failures and errors.


Consumer lag
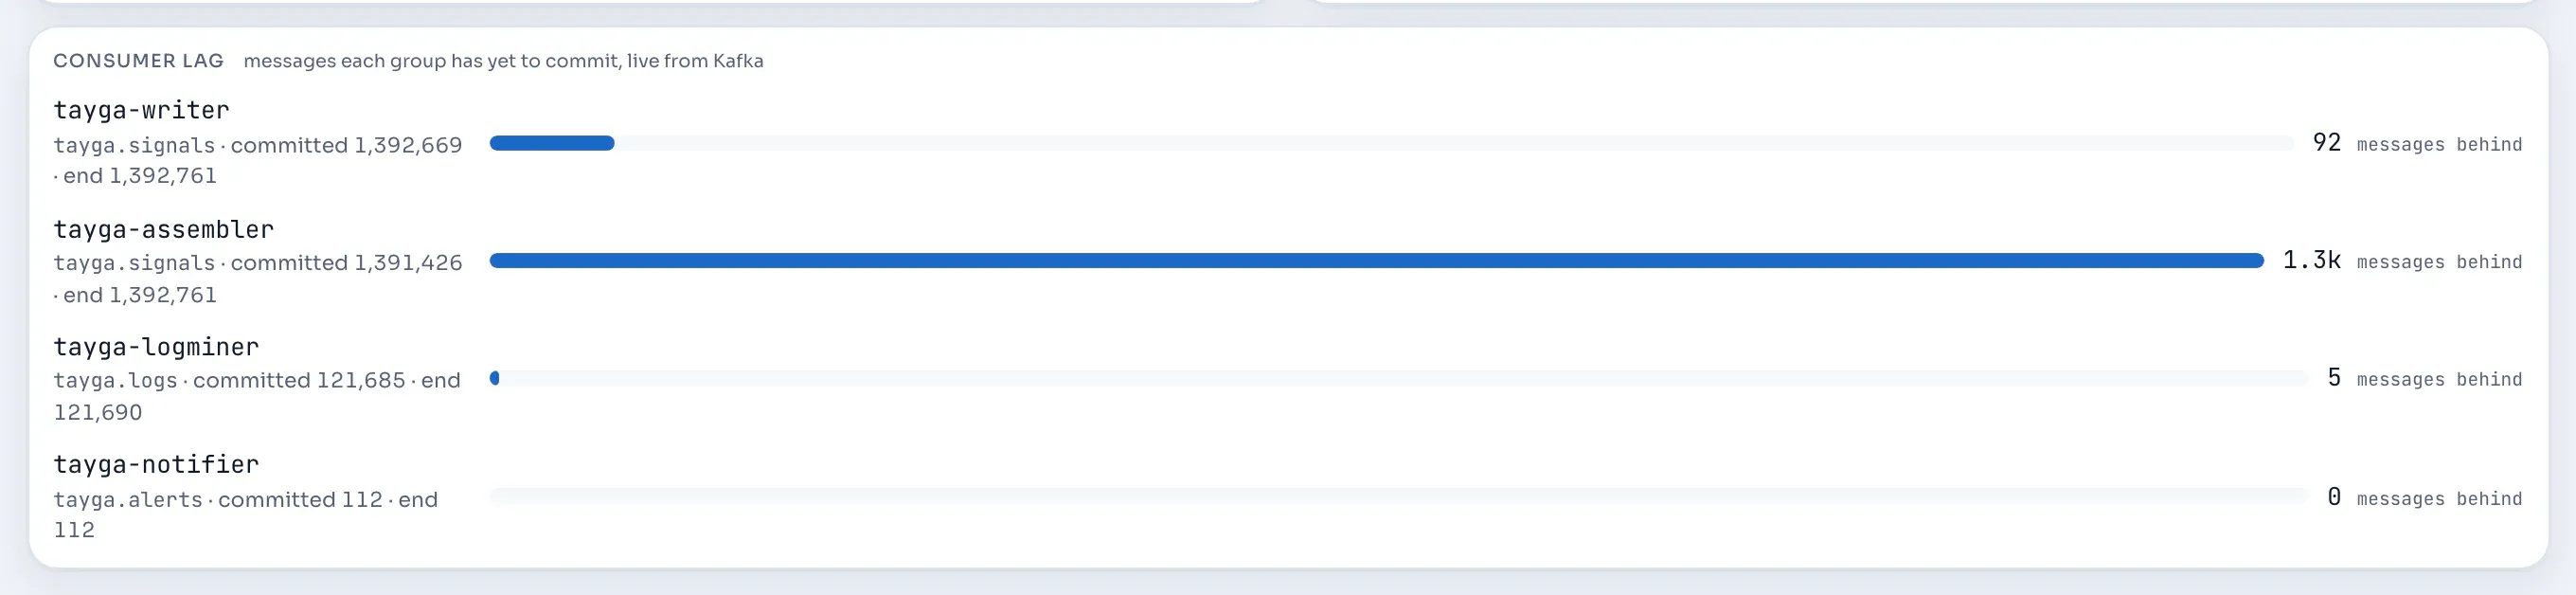
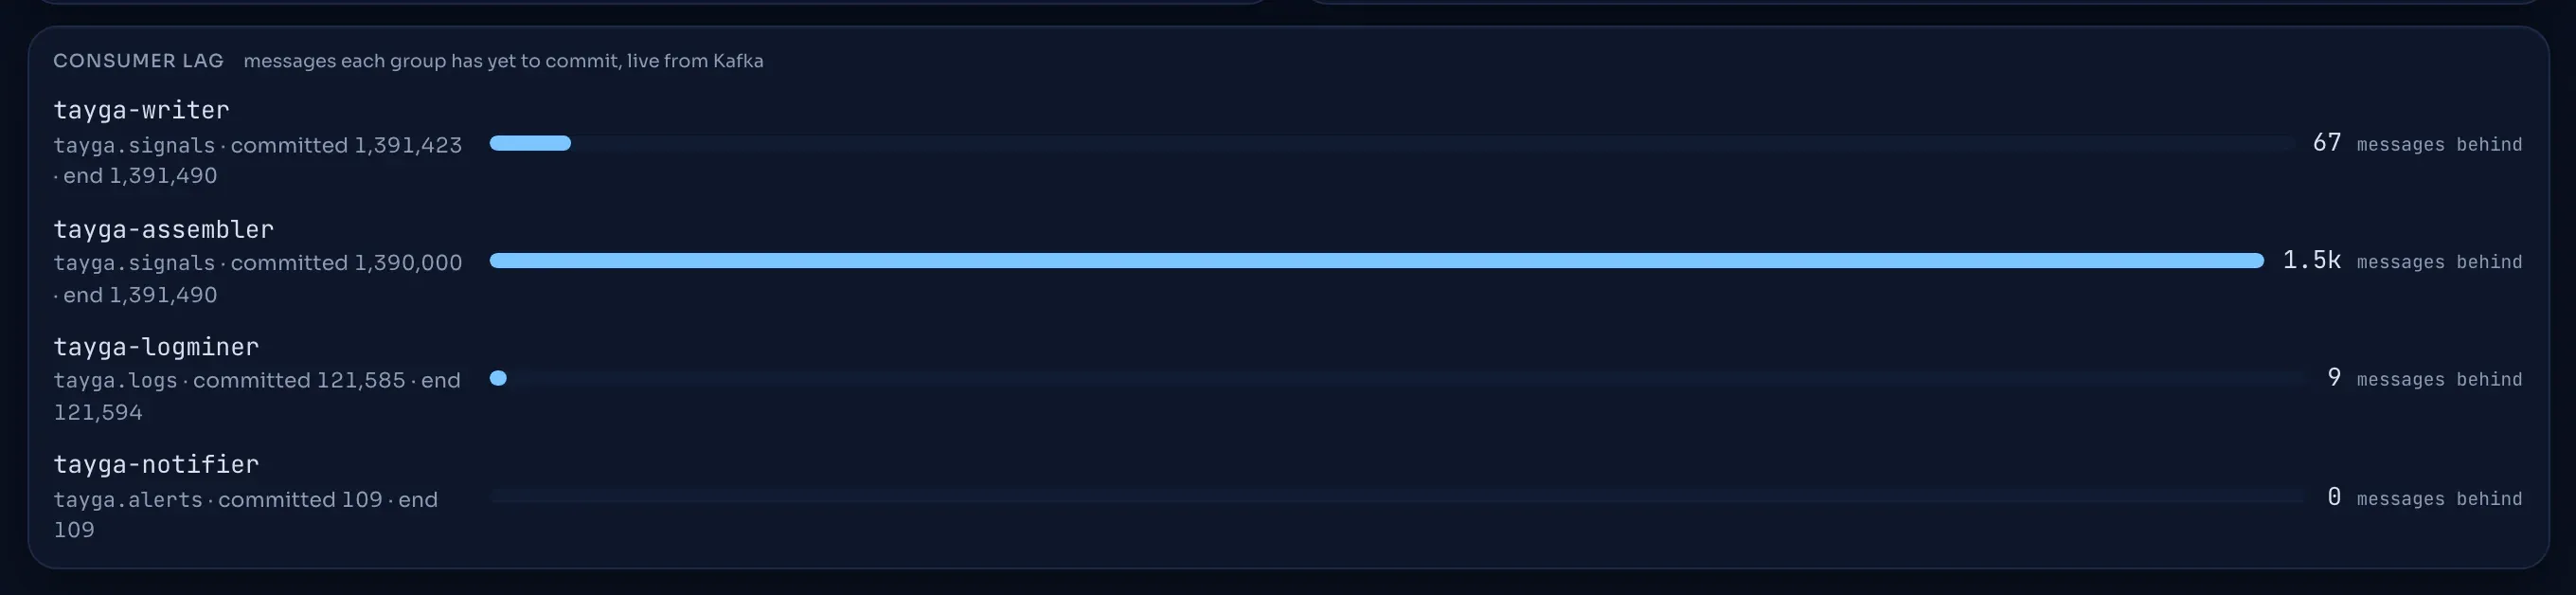
Section titled “Consumer lag”Consumer lag is not a metric: the API reads it from Kafka on request (GET /api/v1/pipeline/lag), at most every 5 seconds, so it is always current, whatever the time range. Each group is read on its own topic: writer and assembler on tayga.signals, the logminer on tayga.logs, the notifier on tayga.alerts. Lag is the high watermark minus the committed offset, summed over partitions.
Grafana and Prometheus (optional)
Section titled “Grafana and Prometheus (optional)”Next to the OpenTelemetry demo, make up-extras also starts Prometheus (127.0.0.1:19090) and Grafana (127.0.0.1:3001, anonymous Viewer access, admin password admin) as the Compose profile extras, and sets the app’s “Open in Grafana” link. make up leaves them out, but does not stop them if they are already running; make down removes them. The standalone bundle does not include them.
Four dashboards are provisioned:
| Dashboard | Shows |
|---|---|
Tayga · Stories (tayga-stories) |
Stories from ClickHouse. |
Tayga · Service map (tayga-service-map) |
Calls between services. |
Tayga · Pipeline health (tayga-pipeline) |
Throughput with units, an “Error counters (5m)” panel with 11 queries, logminer panels, and consumer lag per group on its own topic. |
Tayga · Logs (tayga-logs) |
Alerts by kind, recent alerts, new templates per service, top templates, logs mined per second. |
Prometheus finds every logminer replica through dns_sd_configs; the logminer panels use sum for rates and max for the template count and data lag.
The read-only ClickHouse user
Section titled “The read-only ClickHouse user”Grafana’s ClickHouse datasource connects as the user grafana, defined in deploy/clickhouse/users.d/grafana-readonly.xml with readonly = 1: writes, DDL, temporary tables and setting changes are refused (Code: 164 … (READONLY)), except max_execution_time, which the plugin sets per query.