
Open source · Built in Rust · OpenTelemetry traces and logs
Every failing request, explained.
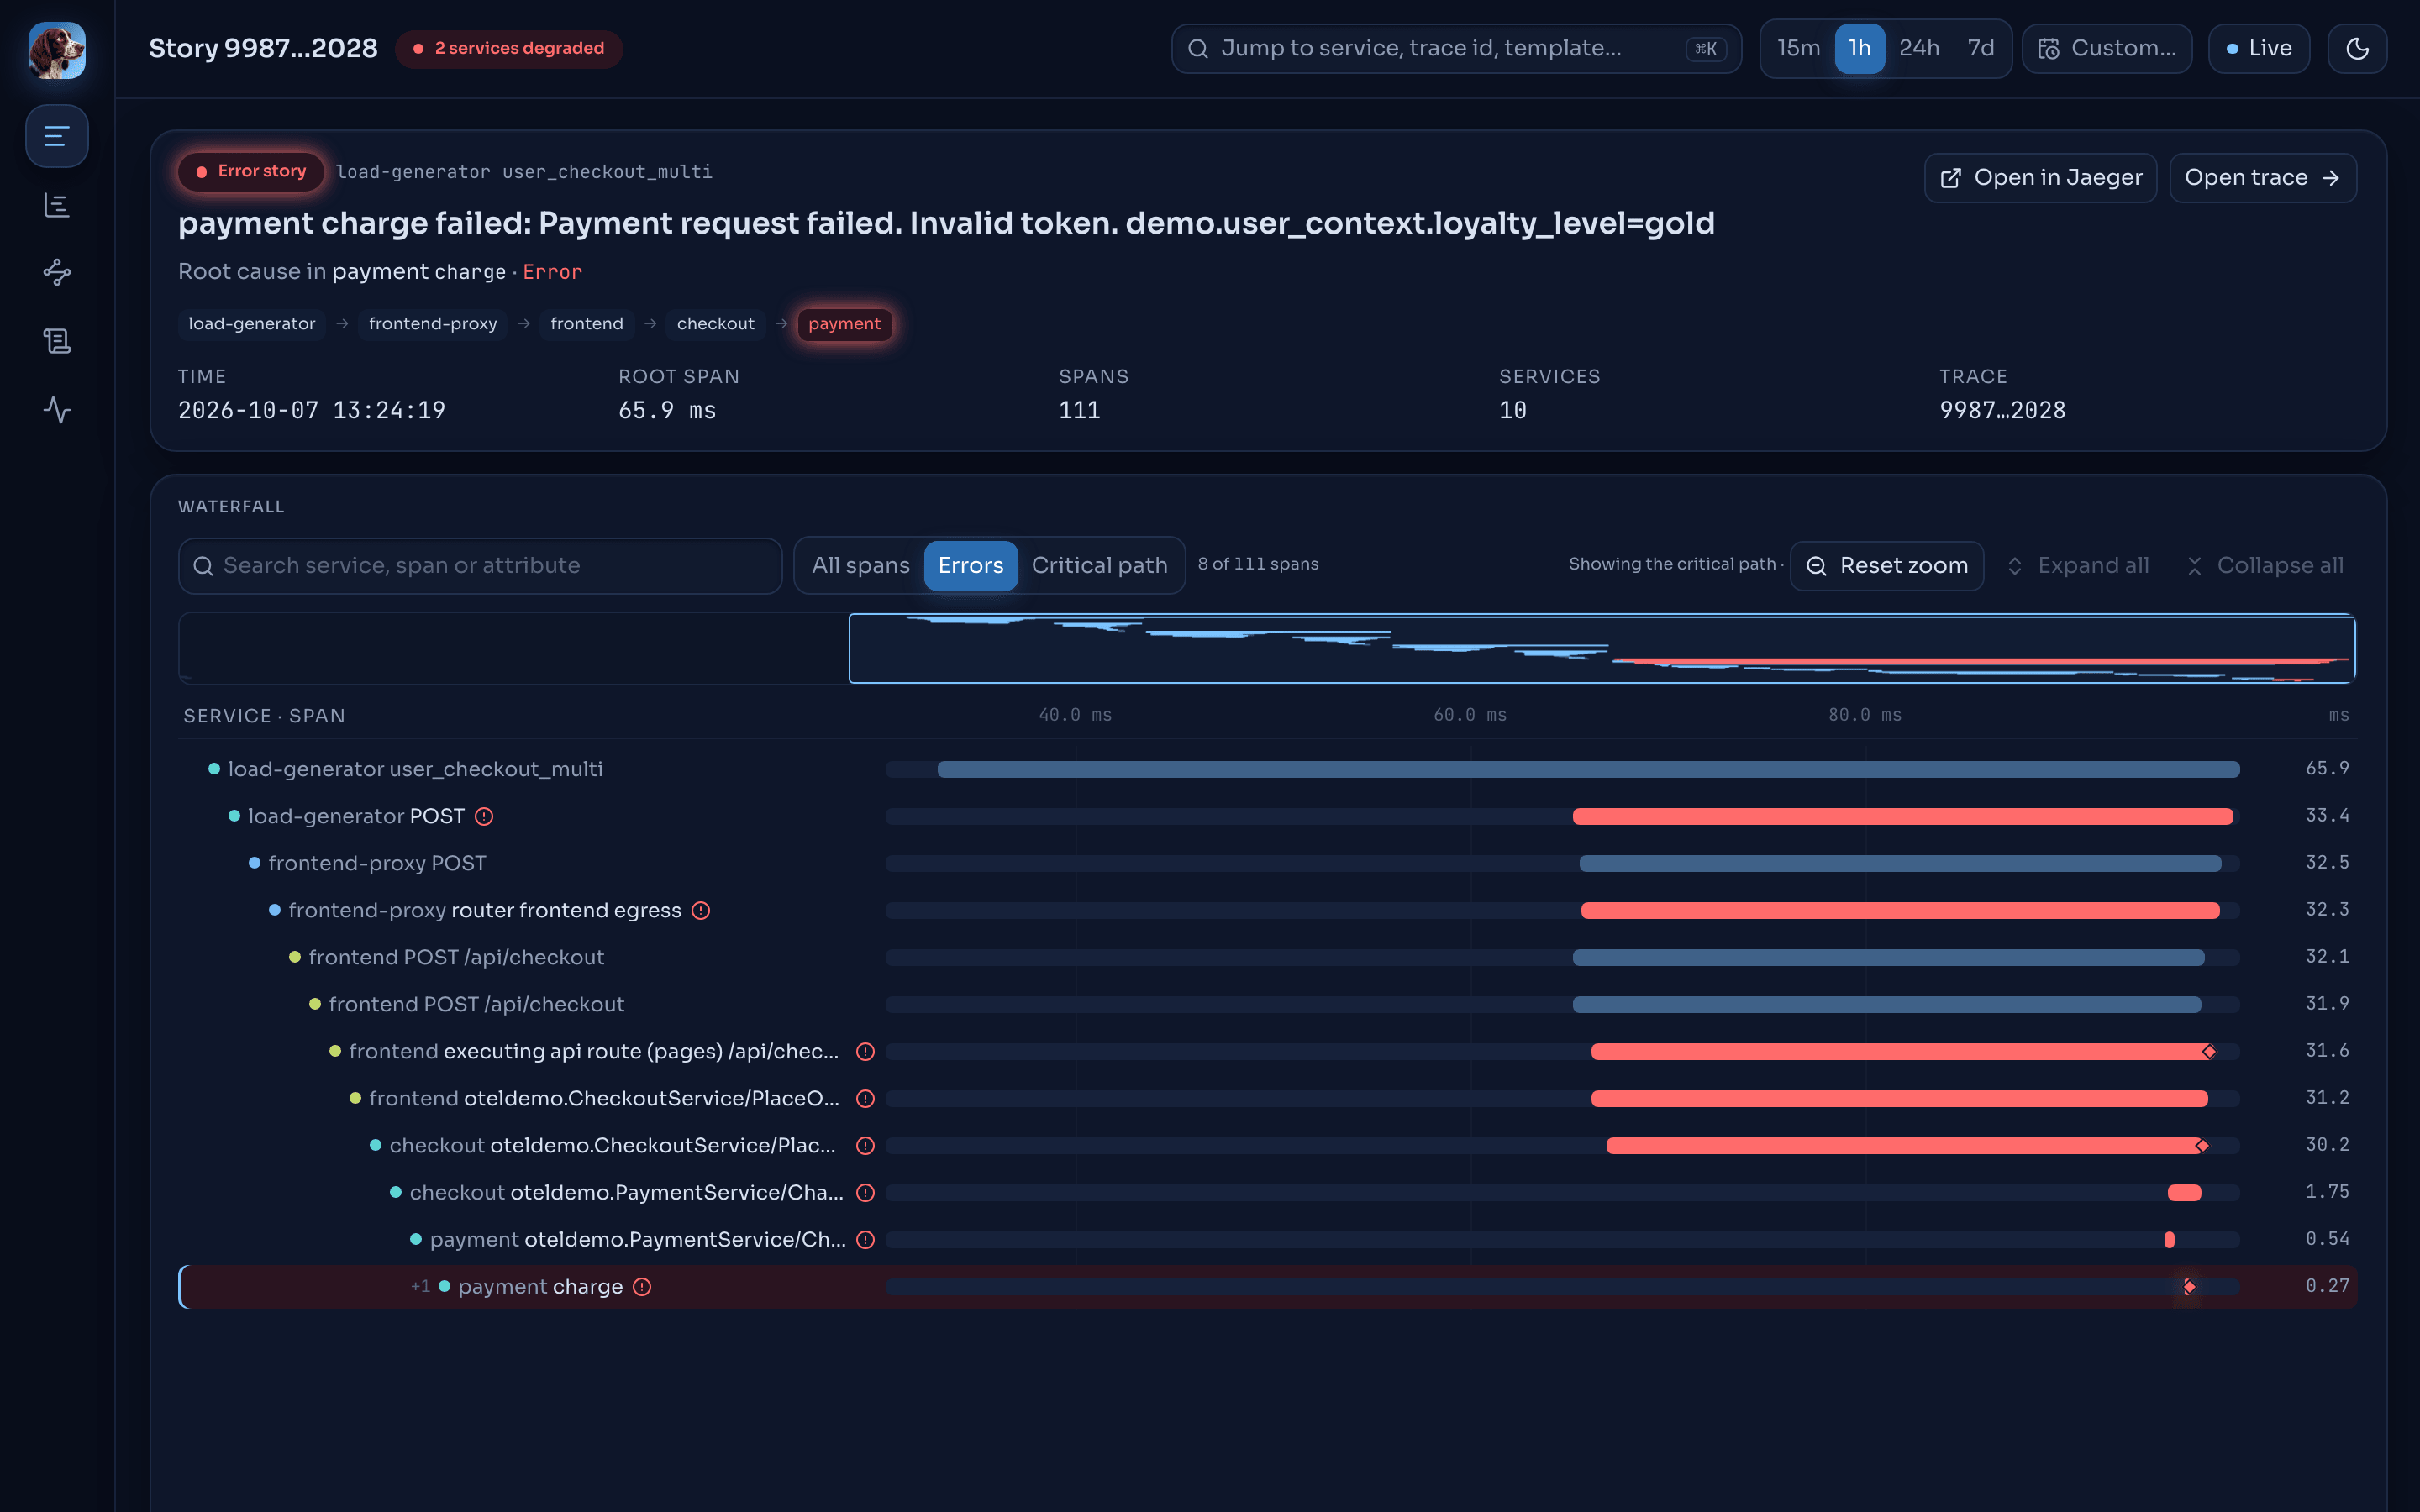
Tayga turns OpenTelemetry traces and logs into error stories. For each failing or slow request it shows the root-cause span, the path across services, the critical path, what differs from the endpoint's normal, and the logs that matter. One problem is one story group, not hundreds of traces.
- OTLP over gRPC and HTTP
- Redpanda / Kafka API
- ClickHouse storage
- Self-hosted, AGPLv3 core
What you get
From raw spans to an explanation
Tayga does the reading for you. It assembles every trace, analyses the failing and slow ones, mines the logs, and shows the result in one web app.
Error stories
The root-cause span, picked from the failing leaves and explained in one sentence, plus the request path across services and the spans that also failed.
Slow stories and the critical path
A request slower than its endpoint's normal, max(p99 × 1.5, p99 + 100 ms), becomes a slow story with the critical path and its top contributors.
Compared with normal
Each story is diffed against the endpoint's baseline from the last hour: new operations, missing operations and slower operations.
Story groups
A fingerprint of kind, endpoint, root-cause span and masked message folds one underlying problem into one group, with its trend.
Log templates
Drain mines every service’s logs into templates as they stream in. Numbers, UUIDs and hex runs are masked; HTTP status codes in access logs are kept.
Log alerts
New-template and rate-spike alerts, plus opt-in silence alerts per template, delivered to webhook and Slack targets with retries.
Service map
Services and their calls with rate, error ratio and p99 against the service's 24-hour baseline. Infrastructure services hide behind one switch.
Trace explorer
Filter by service, endpoint, duration and errors, brush the duration scatter, and open any trace as a waterfall with a span drawer.
Pipeline health built in
Component status, metric history and consumer lag, recorded by the API itself. Prometheus and Grafana stay optional.
How it works
A streaming pipeline, not a query you have to write
Tayga analyses traces as they arrive. By the time you open the app, the failing requests are already stories.
Ingest
Point an OpenTelemetry Collector at tayga‑ingest over OTLP (gRPC or HTTP). Spans are grouped into one record per trace id per export request on Redpanda, keyed by trace id; logs also go to a second topic, keyed by service.
Assemble and analyse
The assembler closes a trace after 10 s without new spans, or 60 s at most, builds the span tree, and turns failing and slow requests into stories with root cause, critical path and baseline diff.
Explain and alert
The logminer mines log templates per service and raises new, spike and silence alerts; the notifier delivers them. tayga‑api serves it all from ClickHouse.
Tour
See a failure become a story
A narrated walk through the app: an injected failure, the story it produces, the service map, log templates and alerts, and the pipeline.
Benchmarks
Measured, dated, sourced
Numbers from the performance report, each with its method and source. Nothing is extrapolated.
2.8µs
per log line through Drain
drain_add over a 50,000-line corpus from the stack, one thread
6.98×
faster mining with the fingerprint cache
cached/add vs add_fingerprinted, same corpus
99.70%
cache hits on the live stack
69,359 of 69,569 lines, first 30 minutes after deploy
1.07%
of one core for the logminer
live demo load, about 40 log lines per second
Criterion micro-benchmarks in a release build on an Apple M3 Max (14 cores); live figures from the OpenTelemetry demo stack on 6 and 7 October 2026. Method and full results
Comparison
Where Tayga fits, honestly
Tayga is a focused tool: it explains failing and slow requests. Here is what it is built for, and when another tool is the better choice.
Choose Tayga for
- Per-request stories, built while traces stream in. Every failing or slow request gets an error or slow story as its trace closes, not when someone writes a query.
- Deterministic rules, no LLM. Root cause, critical path and baselines follow rules you can read. The same input gives the same answer.
- Plain OpenTelemetry in. Anything that speaks OTLP, directly or through a Collector. No proprietary agent.
- Open source, log alerts in the core. New, spike and opt-in silence alerts on log templates are in the AGPL core, self-hosted: your telemetry stays in your ClickHouse and Redpanda.
Look elsewhere if
- You need metrics. Tayga takes traces and logs only. Keep a metrics backend next to it.
- You need full-text log search. Tayga mines logs into templates and links them to stories; it is not a log search engine.
- You want a managed service. The open-source edition is self-hosted.
The full comparison covers, with a source and access date for every cell:
- Jaeger
- Grafana Tempo + Loki
- SigNoz
- Coroot
- OpenObserve
- ClickStack / HyperDX
- Datadog
- Dynatrace
- New Relic
Tayga Enterprise · available on request
Running Tayga across teams and clusters?
The enterprise edition adds identity, isolation, scale and support on top of the open-source core, under a commercial license. It is priced per cluster or node, not per GB ingested.
- SSO / SAML, SCIM, fine-grained RBAC and audit logs
- Multi-tenancy and multi-cluster federation
- High availability, scale-out deployment and upgrade tooling
- PII redaction policies and data-residency controls
- Long-term baselines: compare a release with previous deploys
- ServiceNow, Jira and PagerDuty integrations
- LLM incident summaries with your own model
- Support with an SLA, onboarding and training

Give every failing request a story
Run Tayga next to the OpenTelemetry demo on your laptop, or point your own Collector at it.
Named after Tajga, a hunting dog who can trace anything, anywhere.Why the name