
Baselines
A baseline is what normal looks like for one endpoint: how long its requests usually take, and which operations they usually contain. Tayga uses it twice: to decide whether a request that did not fail was slow enough to become a slow story, and to show, in every story, what differs from normal.
How a baseline is built
Section titled “How a baseline is built”Every 60 seconds (assembler.baseline_refresh_secs) the assembler reloads the baselines of every endpoint from ClickHouse trace_summaries, over the last 60 minutes (assembler.baseline_window_minutes). Only non-error traces count. A baseline holds:
| Part | What it is |
|---|---|
| Trace count | The number of traces it was built from. |
| p50, p95, p99 | Quantiles of the root span’s duration. |
| Per operation | For each operation (service:span name, for example cart:POST /oteldemo.CartService/EmptyCart): its presence, the share of traces that contain it, and the p95 of its longest duration per trace. |
A baseline is trusted once it has at least 50 traces (thresholds.min_baseline_traces). An endpoint with fewer gets no slow stories and no comparison in its error stories.
The slow rule
Section titled “The slow rule”A request that did not fail becomes a slow story when its endpoint has a trusted baseline and its duration is above
max(p99 × slow_trace_factor, p99 + slow_trace_margin_ms) = max(p99 × 1.5, p99 + 100 ms) by defaultThe two terms cover both ends: on a fast endpoint (p99 20 ms) the margin wins and the limit is 120 ms; on a slow one (p99 2 s) the factor wins and the limit is 3 s.
The comparison in a story
Section titled “The comparison in a story”Each story of an endpoint with a trusted baseline carries a baseline_diff:
| List | An operation is listed when | Default |
|---|---|---|
new_ops |
it is in this trace, and in fewer than new_op_presence of the baseline’s traces (or none) |
1 % |
missing_ops |
it is in more than missing_op_presence of the baseline’s traces, and not in this trace |
95 % |
slower_ops |
it is in the baseline, and took longer than max(p95 × slower_op_factor, p95 + slower_op_margin_ms) |
max(p95 × 2, p95 + 50 ms) |
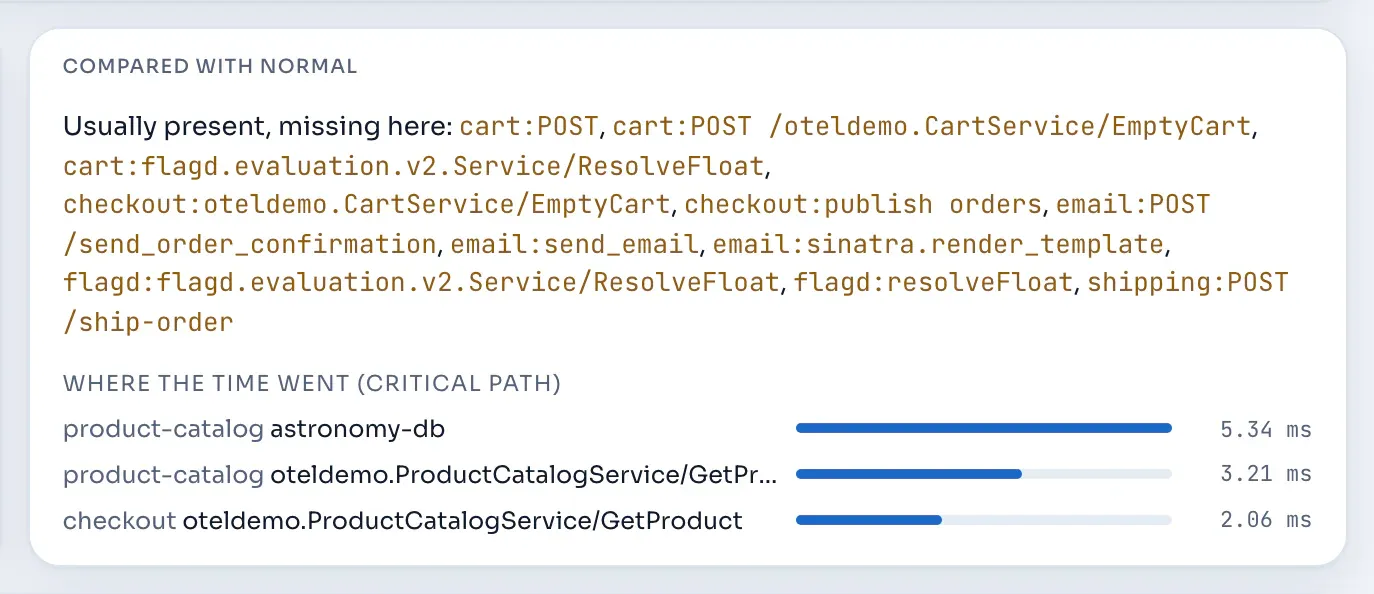
A failing request often stops early, so the steps that normally follow the failure show up in missing_ops. The live error story in the API reference lists 11 of them and no new or slower operations.
Keeping outliers out
Section titled “Keeping outliers out”A baseline that learned from the very requests it should flag would stop flagging them. Each refresh therefore leaves out:
- traces that already have a slow story;
- traces above the endpoint’s previous limit,
max(p99 × 1.5, p99 + 100 ms)of its last trusted baseline. One slow outlier cannot stretch the next baseline; - for an endpoint with no trusted previous baseline (at startup, a new endpoint, or fewer than 50 traces), traces above 10 × the window’s p50.
Long slowdowns
Section titled “Long slowdowns”If nearly every trace of an endpoint is left out (fewer than 50 remain), the endpoint keeps its previous baseline, for at most 2 baseline windows (120 minutes with the default 60). After that the new level is adopted: a slowdown that lasts longer than two hours becomes the new normal and stops producing slow stories.
The carried-over state lives in the assembler’s memory only. An assembler restart during a slowdown learns again through the 10 × p50 bootstrap.
The assembler exports two gauges for this: tayga_assembler_baseline_excluded_traces (traces left out at the last refresh) and tayga_assembler_baseline_carried_endpoints (endpoints whose baseline was carried over). tayga_assembler_baseline_endpoints counts the endpoints with a baseline.
Known limits
Section titled “Known limits”- Traffic. An endpoint needs 50 clean requests an hour for slow stories. A low-traffic endpoint never gets one, and its error stories show no comparison.
- A slowdown that becomes normal. As above: after two baseline windows a slower level is adopted.
- Error traces are not part of the baseline. An outage that fails most requests leaves fewer clean traces, which can drop the endpoint below 50 until traffic recovers.
- Quantiles are approximate. ClickHouse’s
quantilesamples, so two refreshes over the same data can differ slightly. - Replays. Trace summaries are deduplicated per trace with
argMax(…, span_count)over the window, so a replayed trace counts once. When the newest version of a trace lies outside the window, its version inside the window is counted.
Settings
Section titled “Settings”| Setting | Environment variable | Default |
|---|---|---|
assembler.baseline_window_minutes |
TAYGA__ASSEMBLER__BASELINE_WINDOW_MINUTES |
60 |
assembler.baseline_refresh_secs |
TAYGA__ASSEMBLER__BASELINE_REFRESH_SECS |
60 |
thresholds.min_baseline_traces |
TAYGA__THRESHOLDS__MIN_BASELINE_TRACES |
50 |
thresholds.slow_trace_factor |
TAYGA__THRESHOLDS__SLOW_TRACE_FACTOR |
1.5 |
thresholds.slow_trace_margin_ms |
TAYGA__THRESHOLDS__SLOW_TRACE_MARGIN_MS |
100 |
thresholds.new_op_presence |
TAYGA__THRESHOLDS__NEW_OP_PRESENCE |
0.01 |
thresholds.missing_op_presence |
TAYGA__THRESHOLDS__MISSING_OP_PRESENCE |
0.95 |
thresholds.slower_op_factor |
TAYGA__THRESHOLDS__SLOWER_OP_FACTOR |
2.0 |
thresholds.slower_op_margin_ms |
TAYGA__THRESHOLDS__SLOWER_OP_MARGIN_MS |
50 |