
Service map
The service map shows which services call which, how much, how often the calls fail, and whether each service is healthy right now. It is built from the traces Tayga has already assembled; there is nothing to configure except which services count as infrastructure.
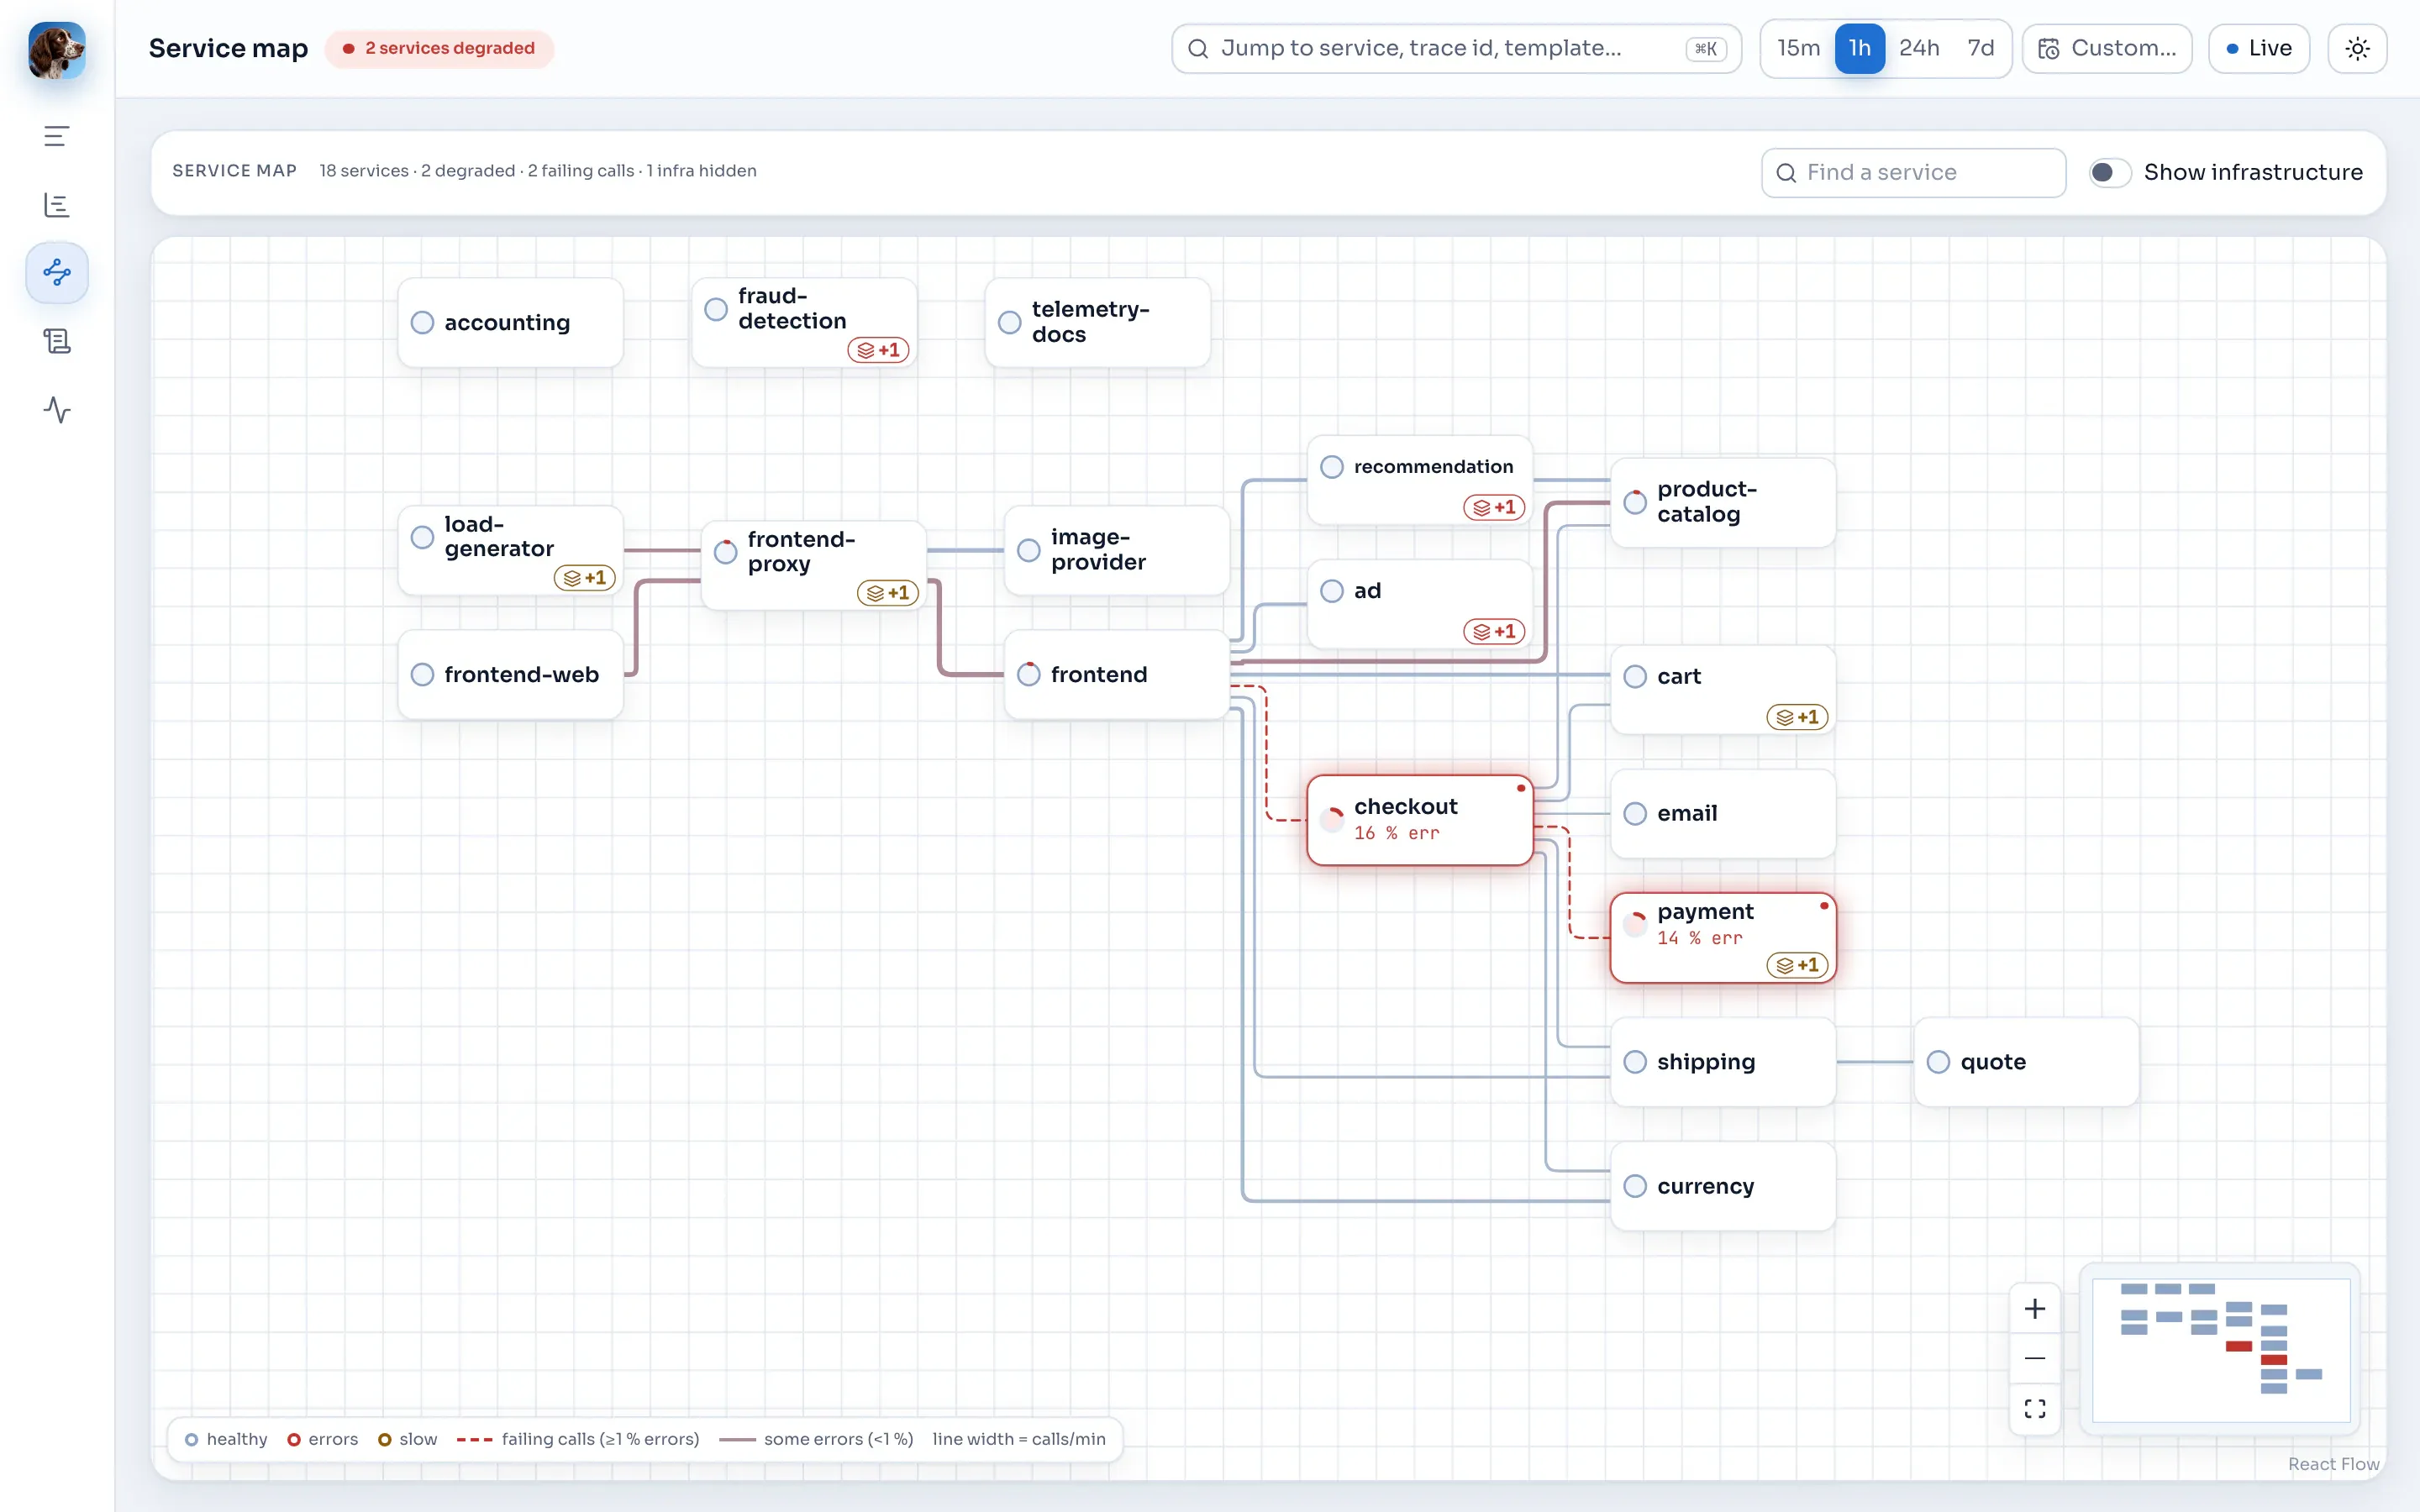
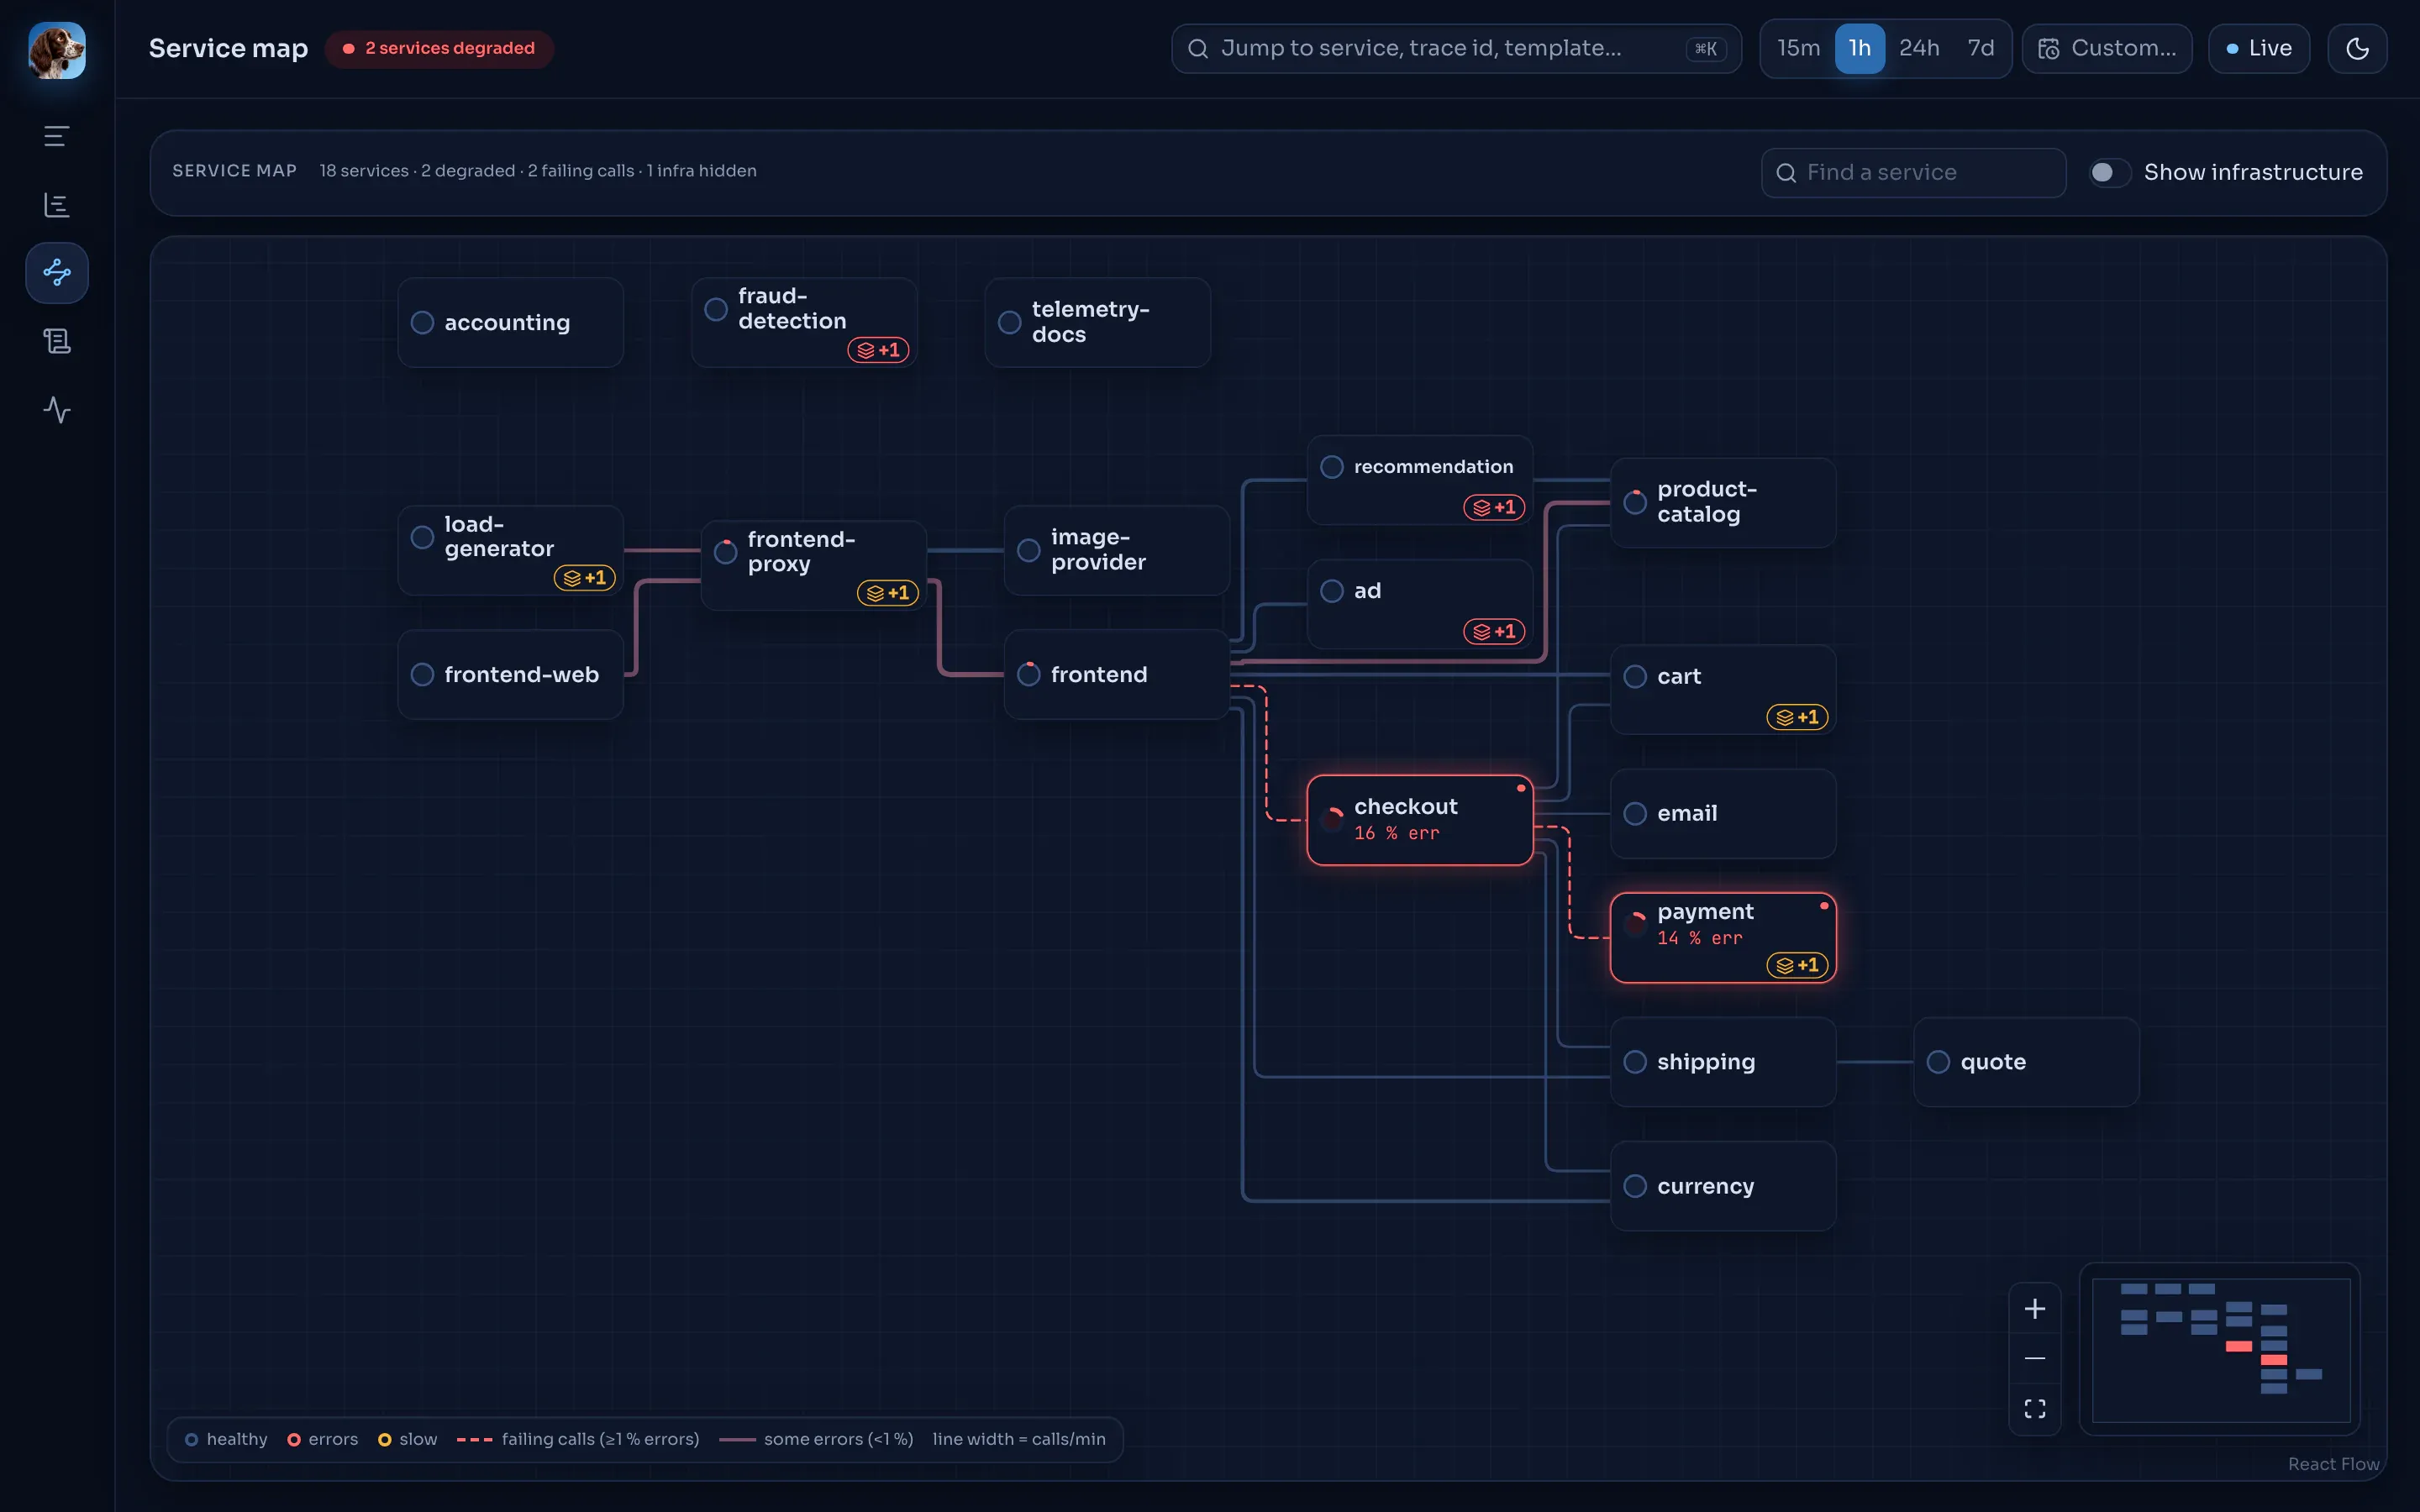
Calls between services (edges)
Section titled “Calls between services (edges)”When the assembler closes a trace, it records one observation for every span whose parent span belongs to another service: the parent’s service, the child’s service, whether the child span is an error span, and the child’s duration. For a typical RPC that is the server span under the caller’s client span, so an edge checkout → payment counts the server-side spans of payment called from checkout.
The observations are summed per minute into ClickHouse service_edges (kept 7 days). For a time window the API returns, per edge:
| Field | Meaning |
|---|---|
parent, child |
Calling and called service. |
calls, errors, error_rate |
Observations in the window, how many were error spans, and their ratio. |
avg_duration_ns |
Mean duration of the called spans. |
Service health (nodes)
Section titled “Service health (nodes)”Each service’s numbers come straight from its raw server and consumer spans in the window (ClickHouse spans):
| Field | Meaning |
|---|---|
calls, rate |
Server and consumer spans in the window, and per second. |
error_ratio |
The share of them with status error. |
p99_ns |
Their p99 duration. |
baseline_p99_ns |
The service’s p99 over the last 24 hours (see below). |
health |
ok, slow or error, by the rules below. |
| Health | Rule |
|---|---|
error |
error_ratio is at least 5 %. Wins over slow. |
slow |
p99_ns is more than 2 × baseline_p99_ns. A service with no baseline is never slow. |
ok |
Neither. |
The 24-hour baseline
Section titled “The 24-hour baseline”The baseline p99 is its own query over the 24 hours that end at the minute floor of the earlier of the window’s end and now. It therefore includes the window itself. The API keeps one result per minute behind a single-flight cell: every map refresh in the same minute, from any number of browser tabs, shares one query, and the value can be up to 60 seconds old. A request for a past window computes its own baseline and does not replace the cached one.
This cut the map’s ClickHouse CPU per refresh from 291.5 ms to 40.0 ms on the live demo stack (see Performance).
Infrastructure services
Section titled “Infrastructure services”Services that almost everything calls, such as the demo’s feature-flag service flagd, would dominate the map. They are listed in [map] infra_services (default ["flagd"]) and hidden unless Show infrastructure is on:
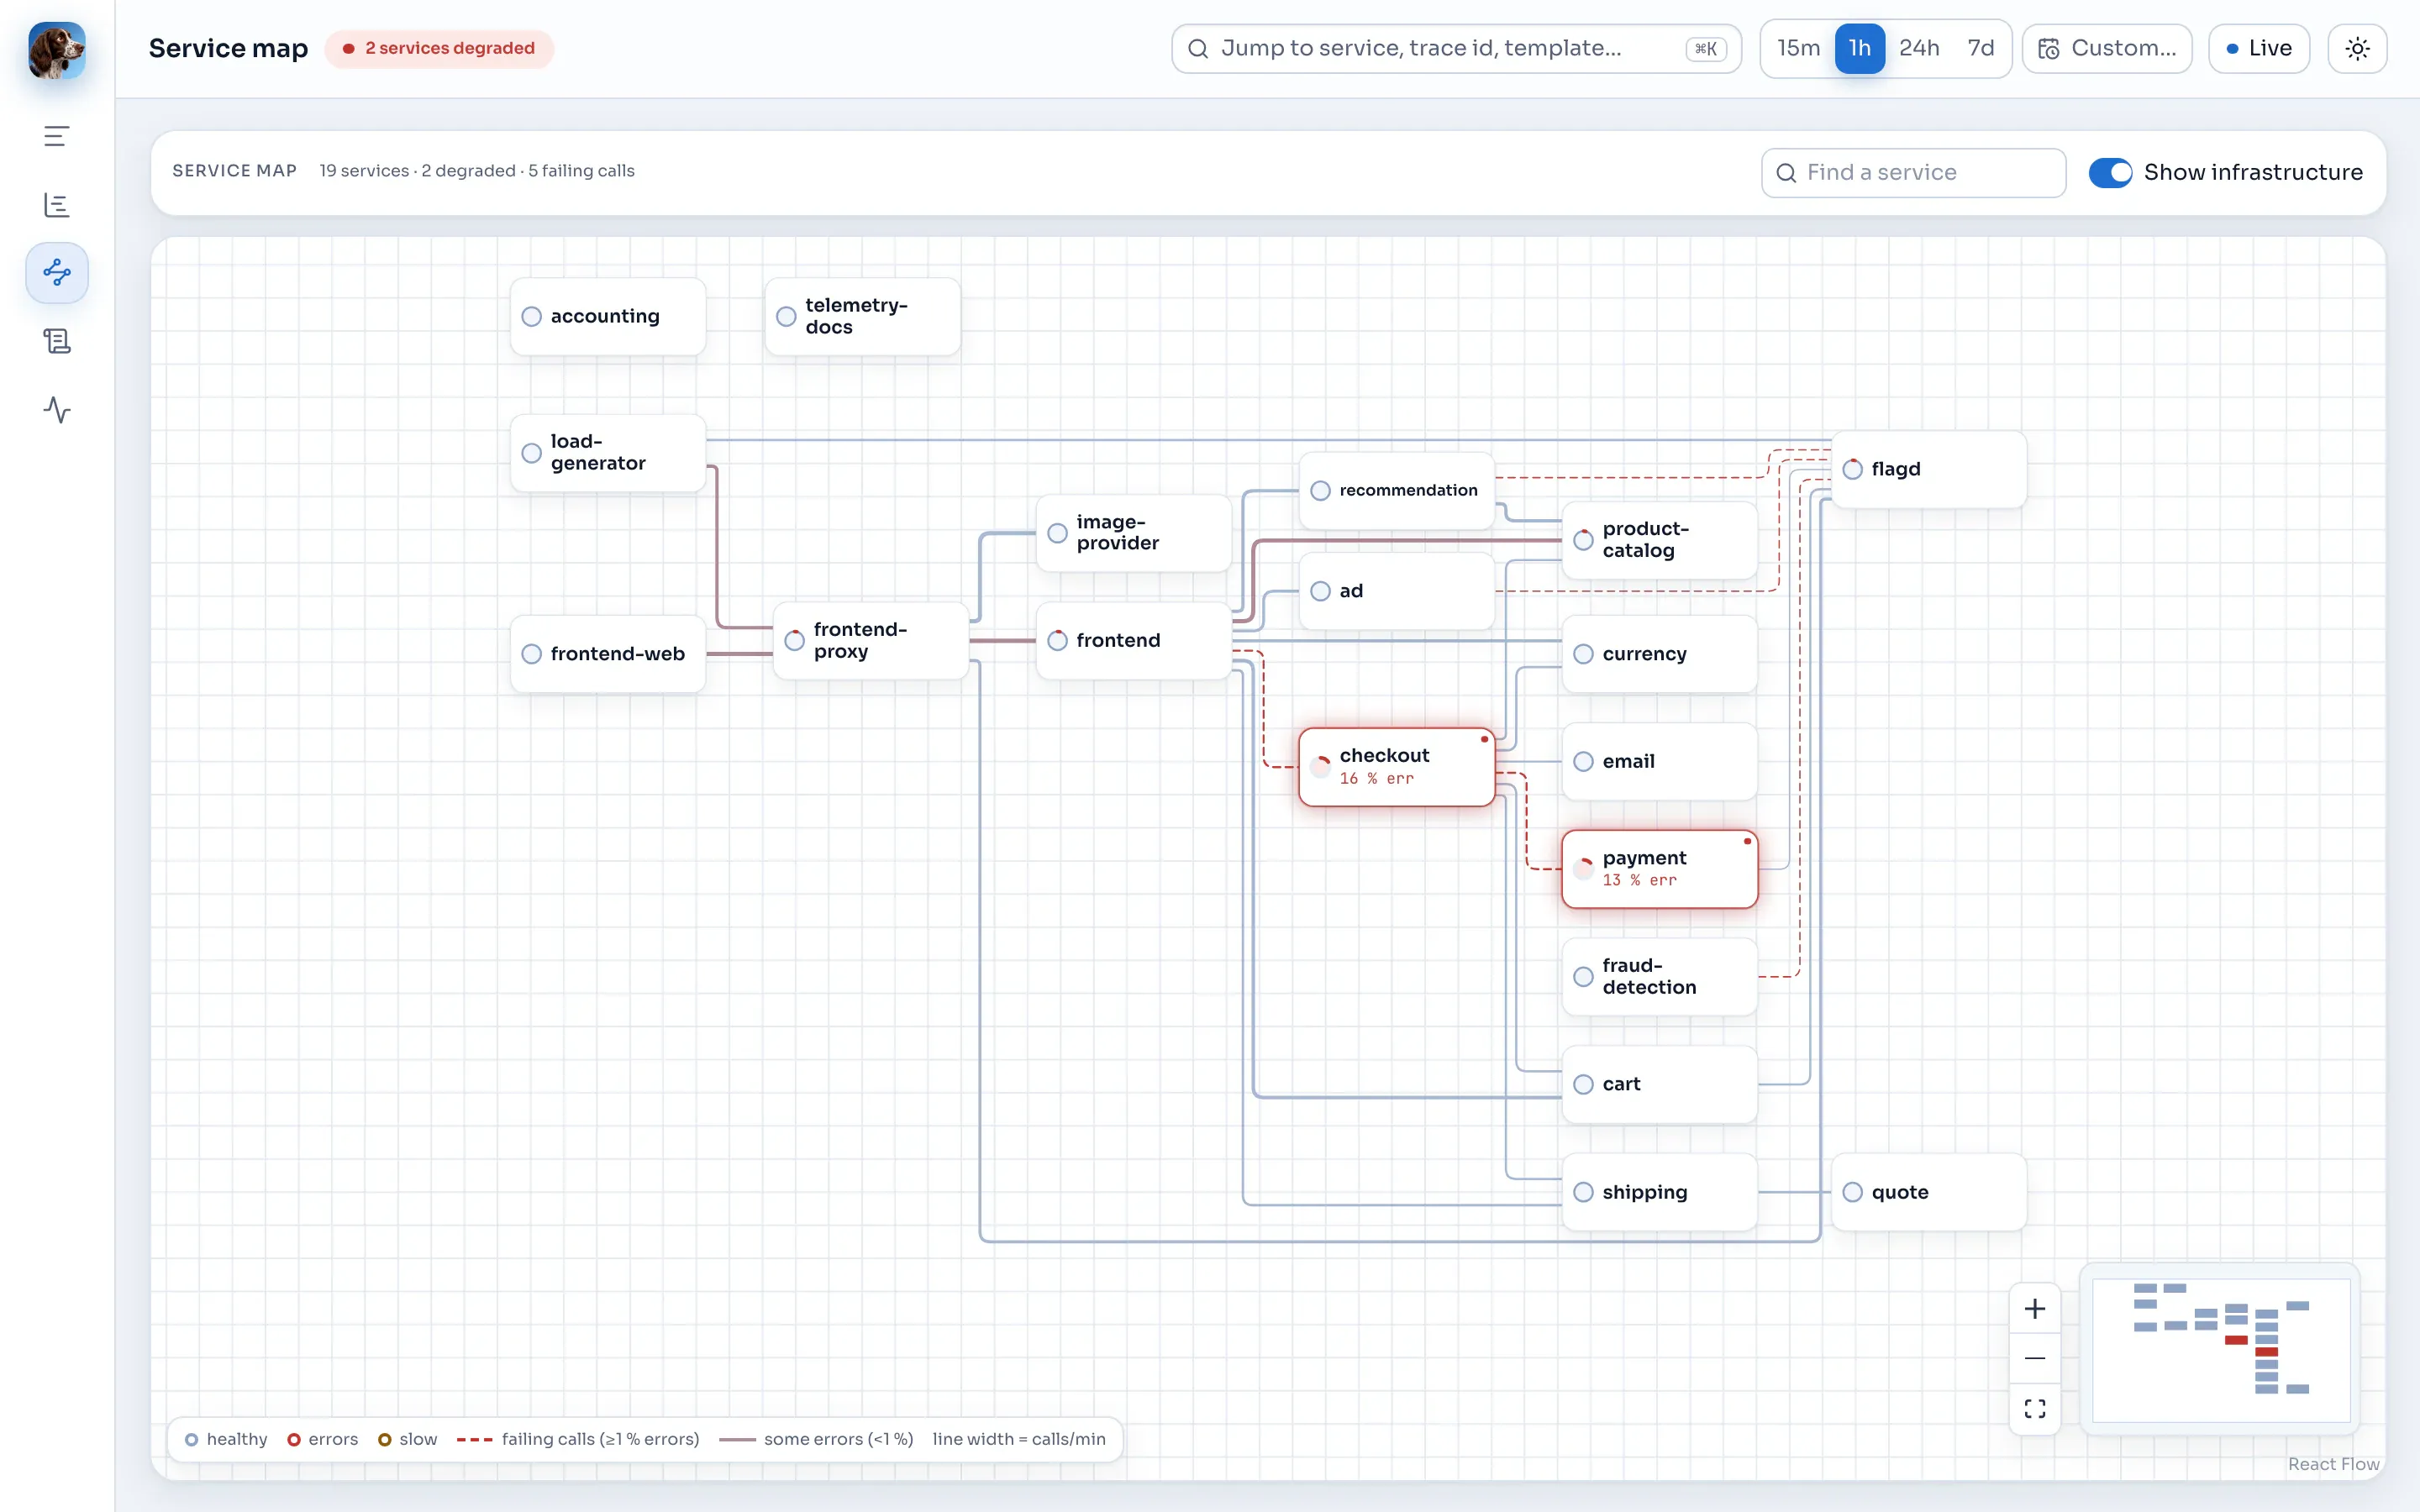
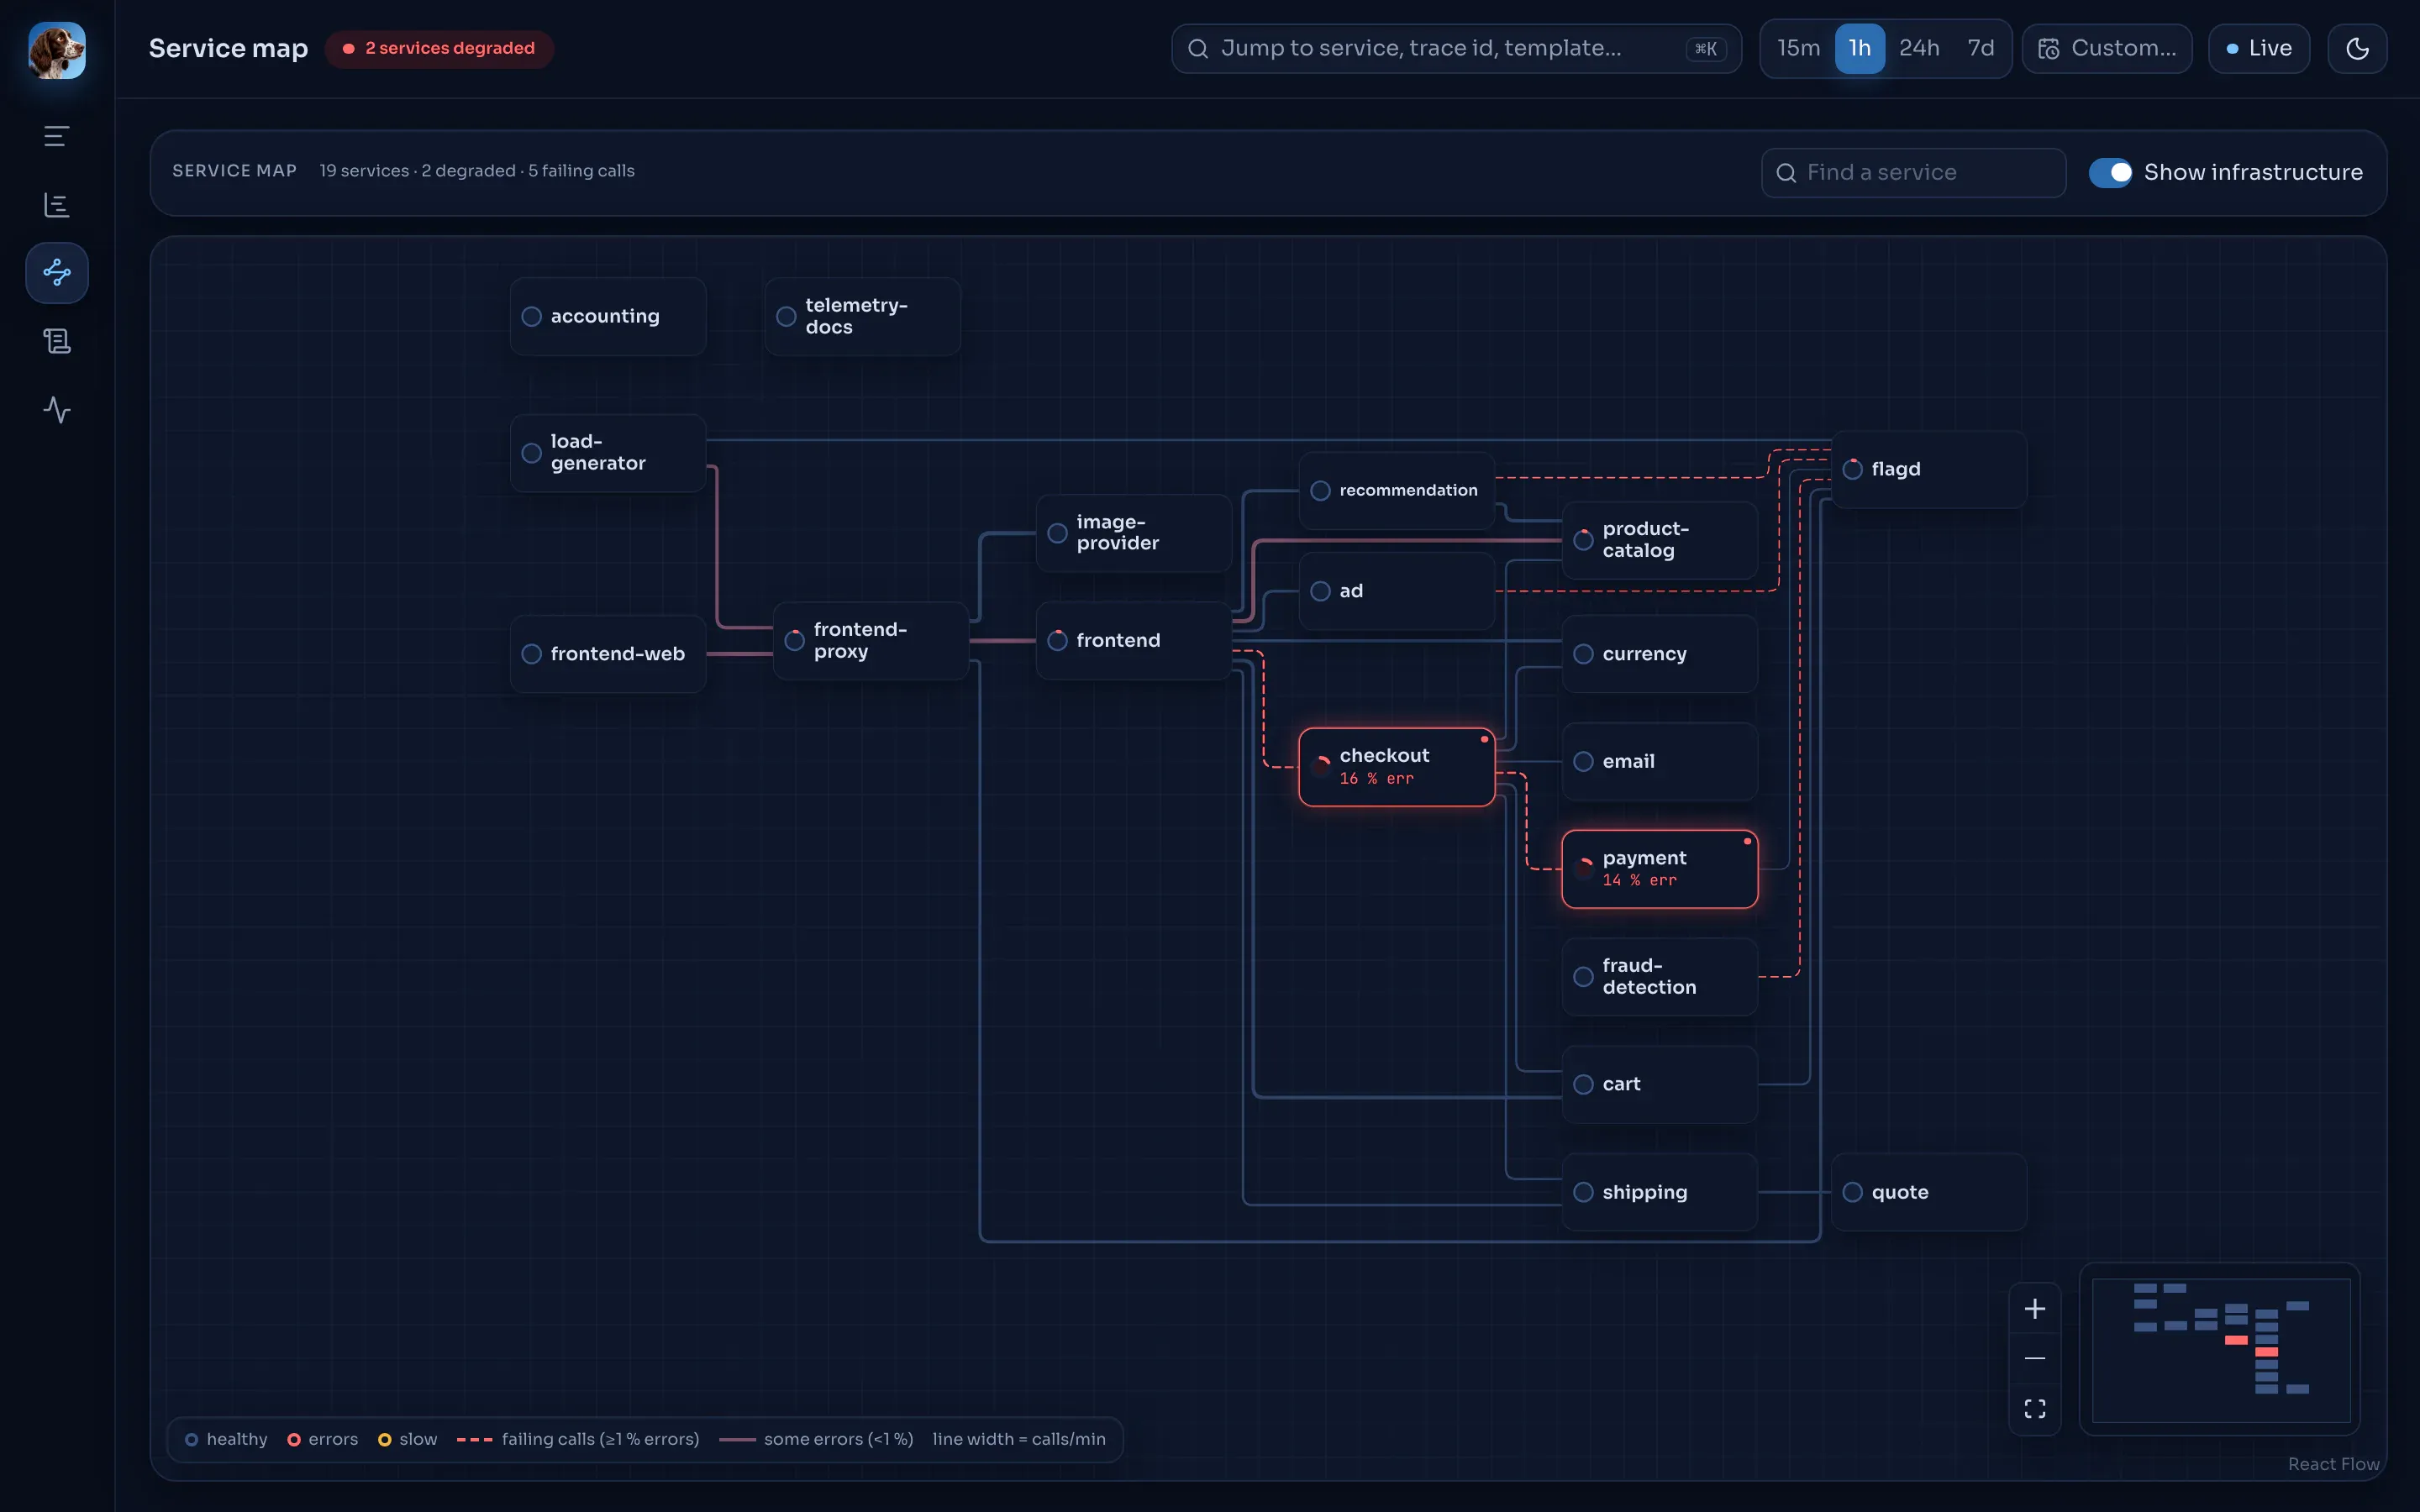
- The switch is kept in the URL as
infra=true. - A service that called a hidden service keeps a +N infra badge on its card: amber, or red when one of those calls is failing. Its tooltip lists each hidden callee with calls per minute and error percentage.
- The summary line adds “· N infra hidden”.
- A service whose calls all went to hidden services stays on the map with its badge, unless it is infrastructure itself.
/map?service=flagdstill opens flagd’s drawer while it is hidden.- The mini map on the Stories page always hides infrastructure services.
- The header’s degraded-services badge still counts them.
- With an empty list the switch is not shown.
The list is a TOML array, so it can only be set in the config file, not with an environment variable:
[map]infra_services = ["flagd", "otel-collector"]TAYGA__MAP__INFRA_SERVICES=flagd,otel-collector stops the API at startup with invalid type: string "flagd,otel-collector", expected a sequence for key map.infra_services. The current list is in GET /api/v1/config.