
Error stories
An error story is Tayga’s explanation of one request that failed or was much slower than normal. The assembler writes one when it closes a trace, so stories exist before anyone opens the app.
A story answers four questions about the request:
- Where did it break? The root-cause span, with a one-sentence explanation.
- How did the request get there? The path of spans from the root span down to the root cause, and the services along it.
- Where did the time go? The critical path and its top three contributors.
- What is different from normal? The comparison with the endpoint’s baseline: new, missing and slower operations.
It also carries the trace’s logs and the other spans that failed.


When a trace becomes a story
Section titled “When a trace becomes a story”The assembler analyses every trace it closes (see Architecture for when that happens). The trace becomes:
| Story kind | When |
|---|---|
error |
At least one span is an error span: its status is error, it has an exception event, or a log attached to it has severity ERROR or higher (severity number 17 and up). |
slow |
No span failed, the endpoint has a trusted baseline (at least 50 non-error traces in the last 60 minutes), and the request took longer than max(p99 × 1.5, p99 + 100 ms) of that baseline. See Baselines. |
| none | Anything else. The trace still gets a trace summary and its service-to-service calls are counted for the service map. |
A trace that has only logs and no spans produces nothing.
The endpoint of a trace is the service of its root span plus the root span’s name. When that name has no / in it, Tayga appends the path from the span’s http.route, url.path, url.full or a similar attribute, with the query removed and any path segment that has a digit or is longer than 24 characters replaced by <*>. So a root span GET with http.url = http://frontend-proxy:8080/api/cart?x=1 becomes the endpoint GET /api/cart.
What a story contains
Section titled “What a story contains”| Field | Meaning |
|---|---|
story_id |
The trace id. One story per trace, so a replayed trace overwrites its story instead of adding a second one. |
fingerprint |
The story group key (a decimal string). See Story groups and fingerprints. |
kind |
error or slow. |
ts_ns, duration_ns |
Start and duration of the root span, in nanoseconds. |
endpoint_service, endpoint_name |
The endpoint, as above. |
root_cause |
The root-cause span (service, span name, kind, span id), its error message and exception type. For a slow story the message is slow. |
summary |
One sentence. For example payment charge failed: Payment request failed. Invalid token. or checkout could not reach oteldemo.PaymentService (oteldemo.PaymentService/Charge): name resolver error: produced zero addresses (both from the OpenTelemetry demo). |
path_services, path_spans |
The path from the root span to the root cause. Consecutive spans of the same service collapse into one entry in path_services. |
critical_path |
The segments that determined the request’s duration, and the top three spans by self time on that path. |
baseline_diff |
New, missing and slower operations against the endpoint’s baseline. Present only when the endpoint has a trusted baseline. |
logs |
Up to 50 of the trace’s logs, the most severe first. |
also_failed |
The other failing leaf spans, earliest end first. |
span_count, flags |
The number of spans, and the flags below. |
The HTTP API shows a full example.
| Flag | Meaning |
|---|---|
incomplete |
The span tree was not whole: a span named a parent that never arrived, there were several root spans, or a parent cycle had to be cut. The analysis still runs on the tree it has. |
truncated |
The assembler closed the trace early because it had more than 10,000 spans, or because the buffered traces as a whole passed 512 MB. |
Error stories and slow stories
Section titled “Error stories and slow stories”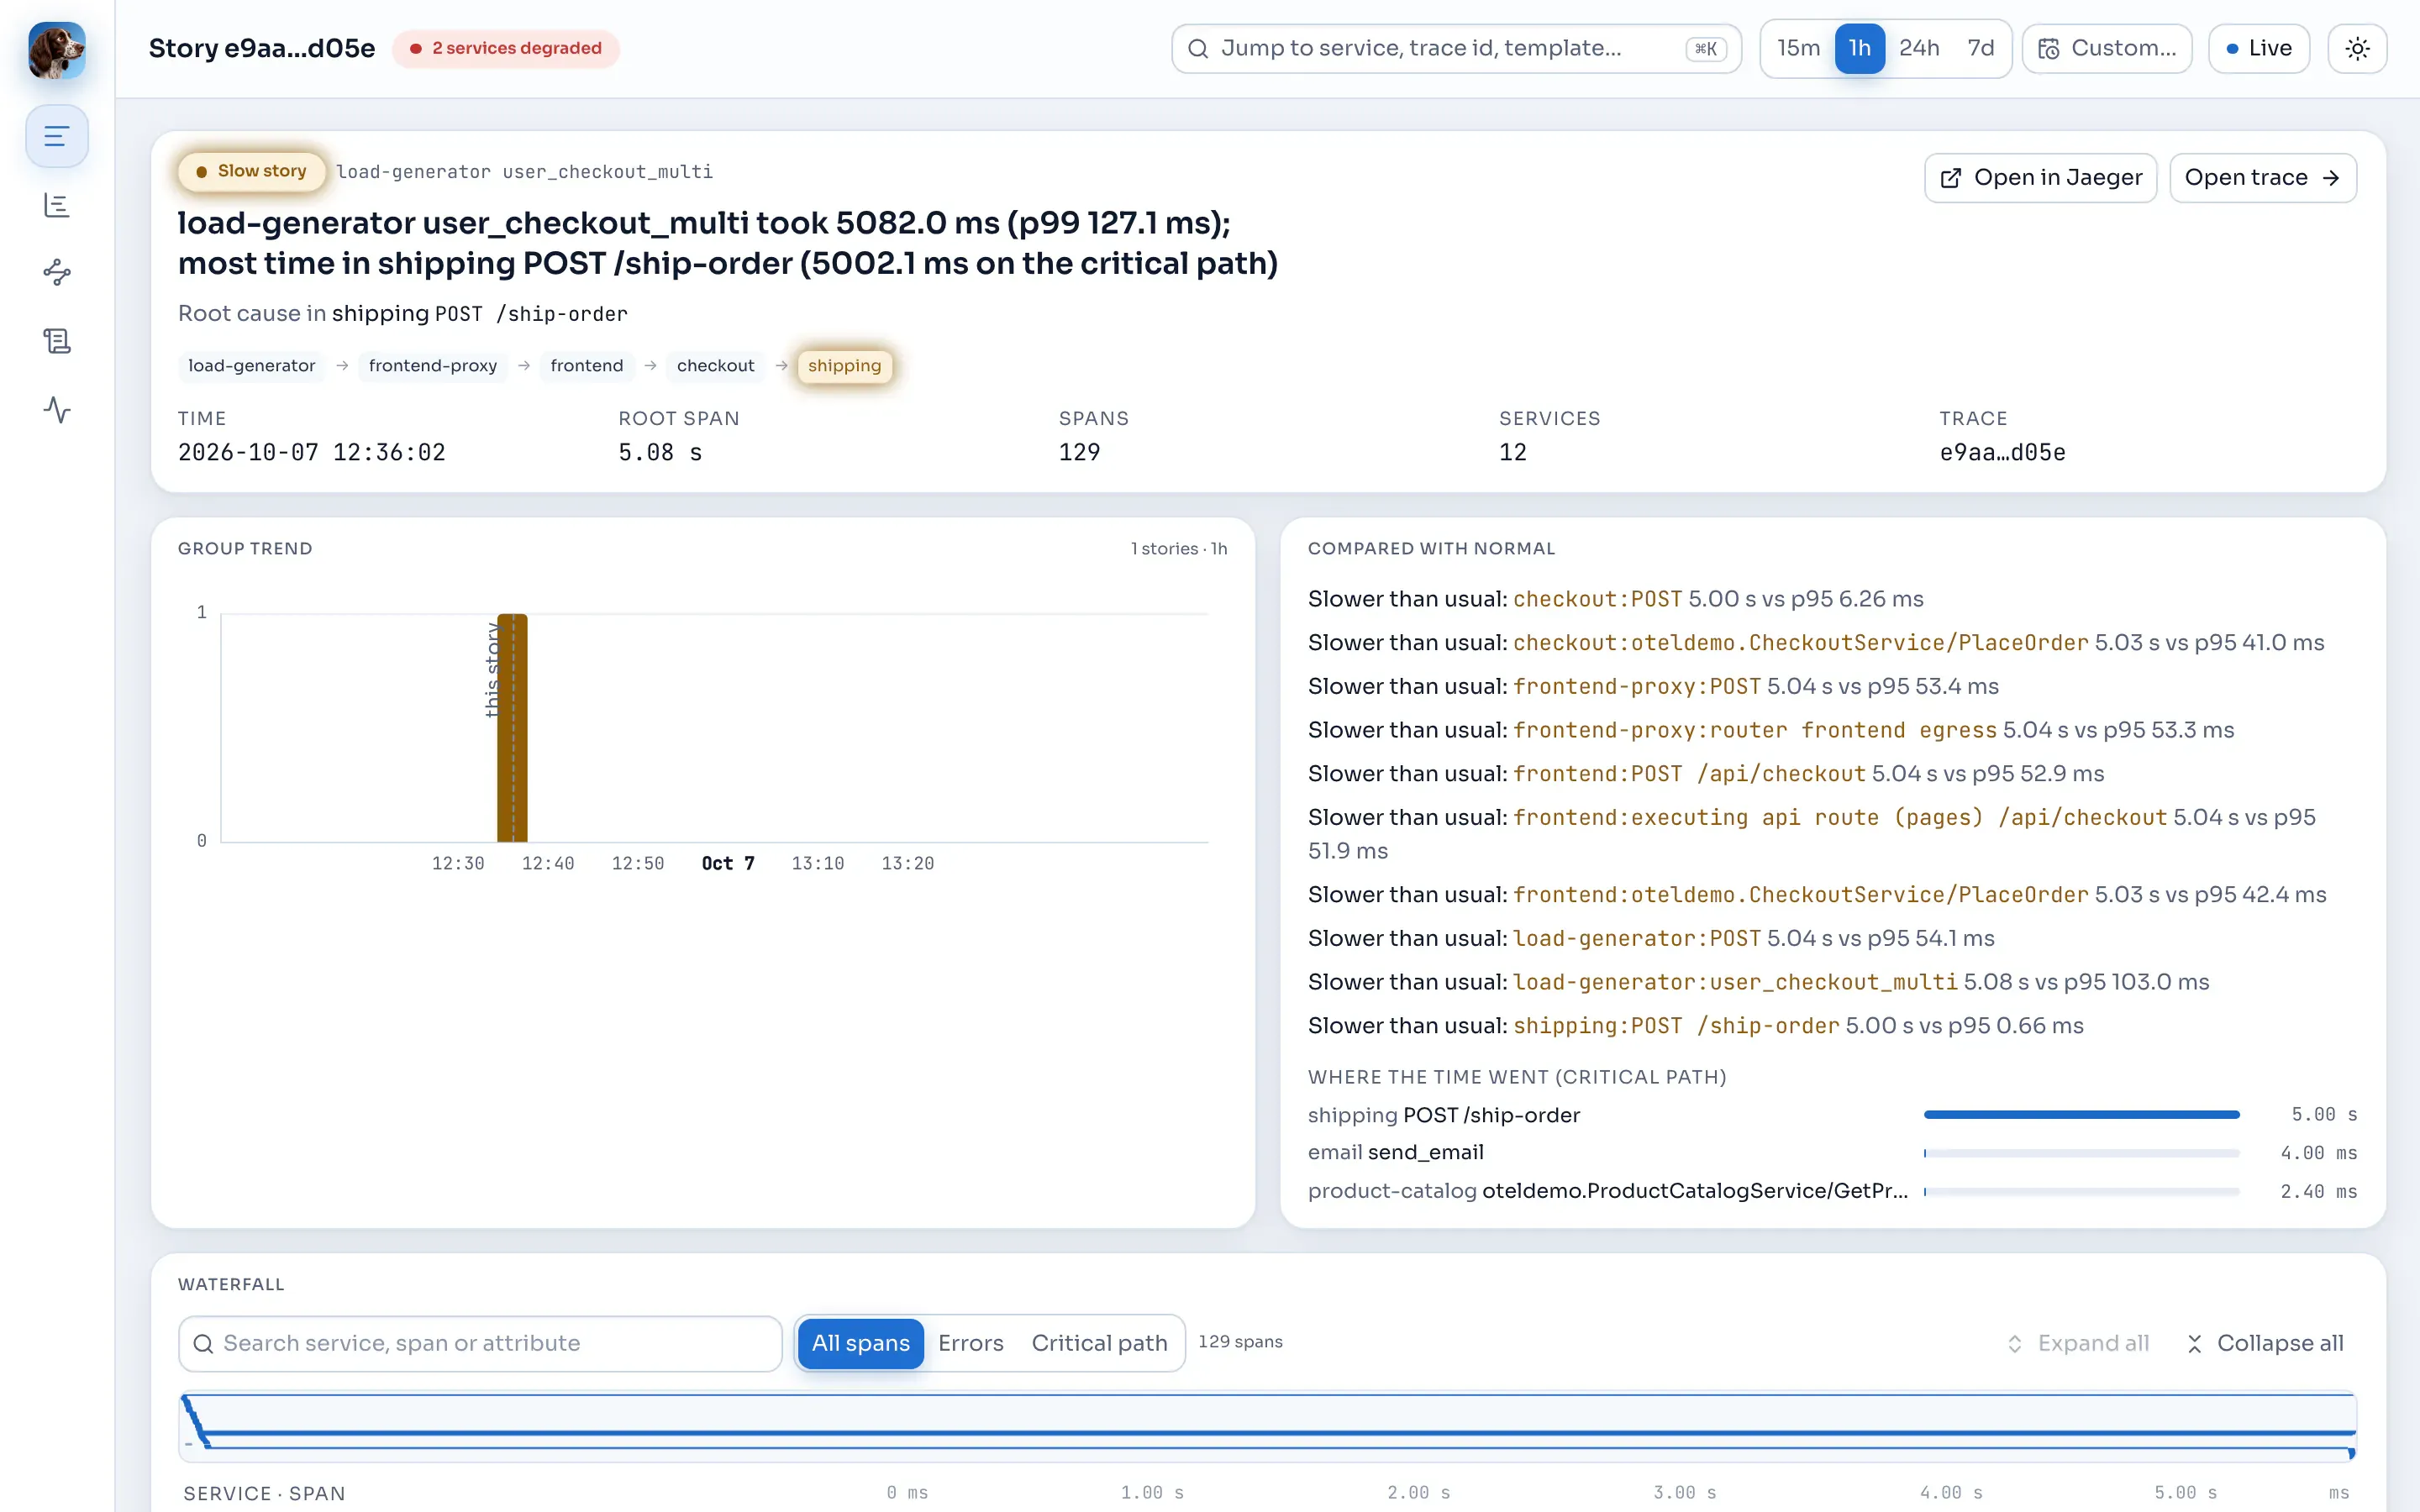
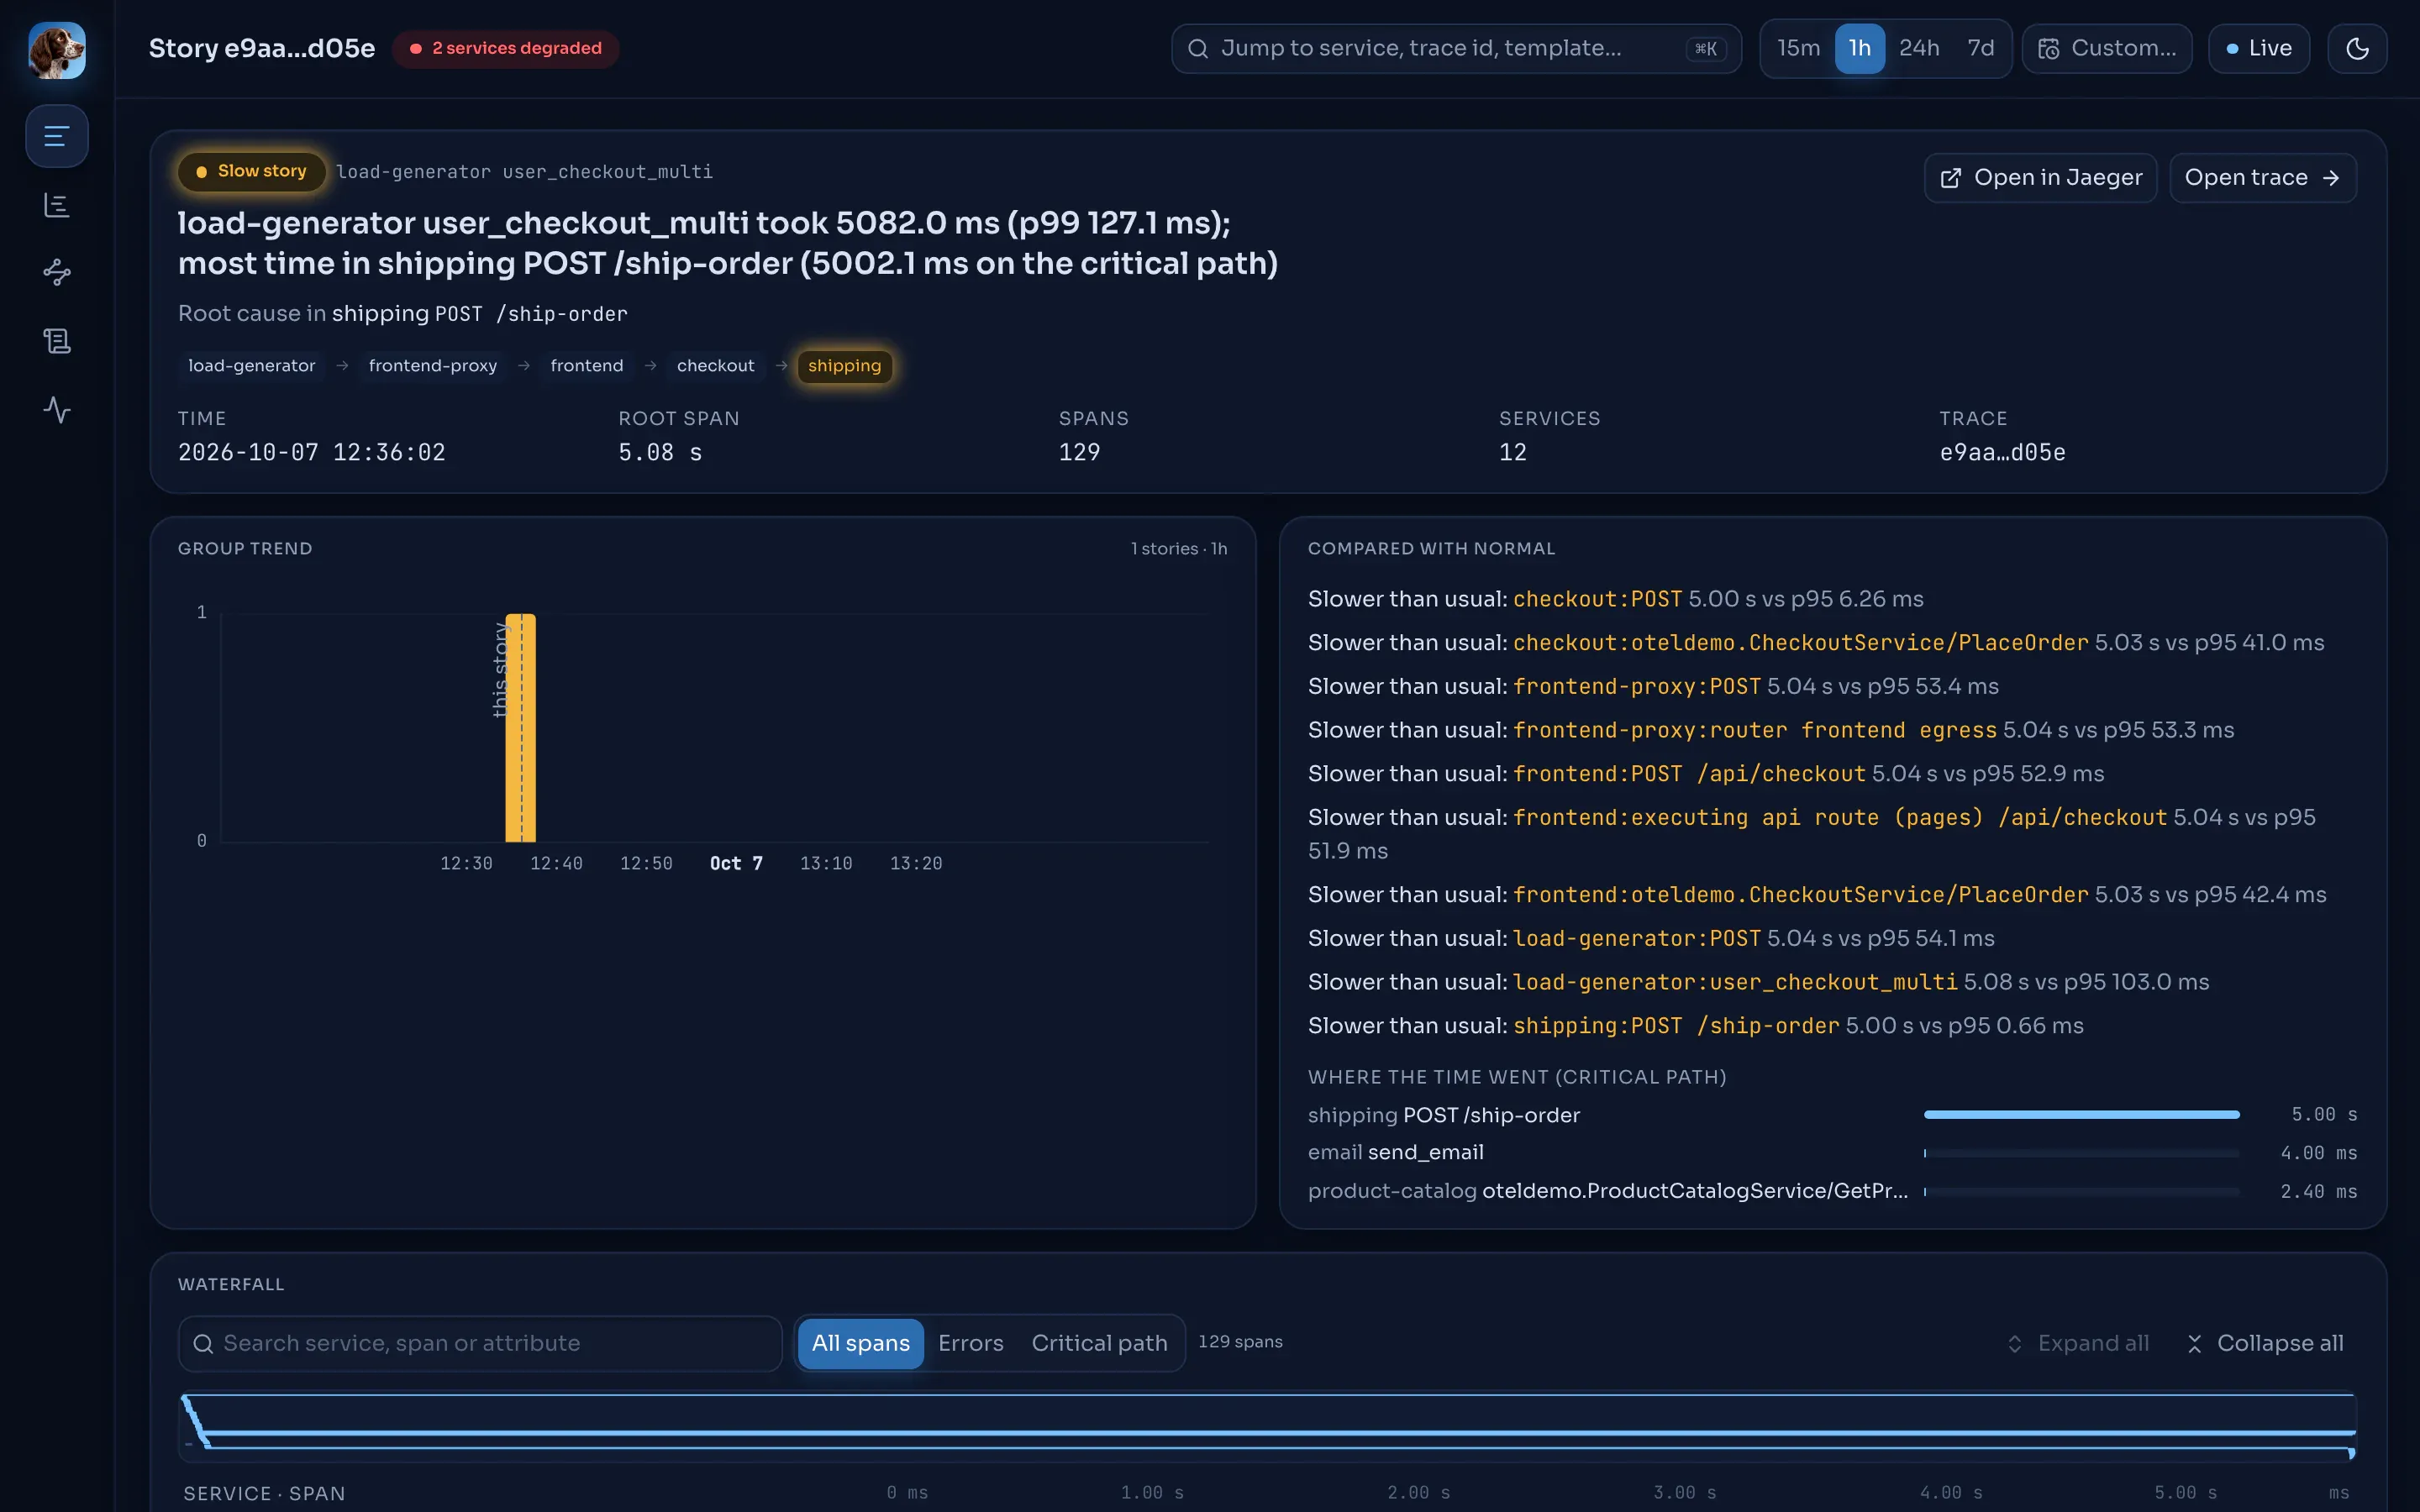
The two kinds are built the same way. They differ in how the root cause is chosen:
- In an error story the root cause is the failing span with no failing descendants that ended first. See Root cause and critical path.
- In a slow story nothing failed, so the root cause is the span with the most self time on the critical path. Its summary reads, for example,
load-generator user_checkout_multi took 5082.0 ms (p99 127.1 ms); most time in shipping POST /ship-order (5002.1 ms on the critical path).
Late spans and logs
Section titled “Late spans and logs”The assembler closes a trace when it goes quiet for 10 seconds (processing time) or has been open for 60 seconds. A span or log that arrives after that is counted in tayga_assembler_late_items_total and is still stored raw by the writer, so it shows up in the trace view, but the story is not analysed again.
A long-running trace whose spans are more than a minute apart can therefore close in pieces: each piece is analysed as its own trace and can produce its own story. The trace search keeps only the version with the most spans of each trace.
Where stories go
Section titled “Where stories go”- ClickHouse
error_stories, kept 7 days. It is aReplacingMergeTreekeyed by story id, so a replayed trace collapses into one row. The web app and the API read from here. - The Redpanda topic
tayga.stories, as JSON keyed by the story’s fingerprint. The JSON is the analysis record (root_causeholds the full span;critical_pathandtop_contributorsare separate fields), so it differs slightly from the API’s shape. Nothing in Tayga reads it; it is there for your own consumers. It has 3 partitions and, when Tayga creates it, a retention of 24 hours.